9.3.4 Highest risk threats

Based on the assessments of the 45 identified threats (Figure 9.2 and Figure 9.3), 8 out of the 10 threats identified in 2019  as presenting a very high risk to the Region’s ecosystem and heritage values are again rated as very high risk. Another 13 and 18 threats are rated as high risk to the Region’s ecosystem and heritage values, respectively. Very high is the highest level of risk in the assessment matrix (Appendix 7); no further increase in risk level occurs despite any additional increases in a threat’s likelihood or worsening of its consequences (Appendix 7). 

Climate change remains the greatest risk to the ecosystem and heritage values of the Region, on a Region-wide scale, with four climate change related threats posing a very high risk, and one posing a high risk (Figure 9.2 and Figure 9.3). The risk of climate change is predicted to continue increasing (Section 6.3).608,1539 

Climate change threats pose the highest risk to the Region’s ecosystem and heritage values

Climate change associated threats impact the natural resilience of the Region’s key habitats and underlying ecological processes through exacerbating both acute and chronic disturbances and shrinking recovery windows.541,644,1604 For instance, deoxygenation is associated with the warming of the surface ocean (sea-temperature rise)657 (Box 6.2). While impacts of deoxygenation on tropical ecosystems are demonstrated, the degree to which deoxygenation is currently affecting the Region remains a knowledge gap. It is anticipated that impacts on species and habitats will be observed within the Region in the future if, as predicted, global and coastal deoxygenation of oceans continues alongside other climate related impacts. Climate change can also exacerbate the impact of other threats. For example, the health of inshore coral reefs is influenced by land-based runoff and coastal development. The effects of climate change, such as sea-temperature rise,1615 ocean acidification 1665 and altered weather patterns,554 may cause additional stress for these reefs and further increase their susceptibility to disease.

Risks to Indigenous, historic and other heritage values from activities that physically disturb or place material on the seafloor are likely to remain underestimated due to limited systematic identification and understanding of the extent and location of many heritage values, such as burial sites, wrecks and archaeological sites. The potential for significant or permanent damage to sites of cultural or historical importance is a concern.

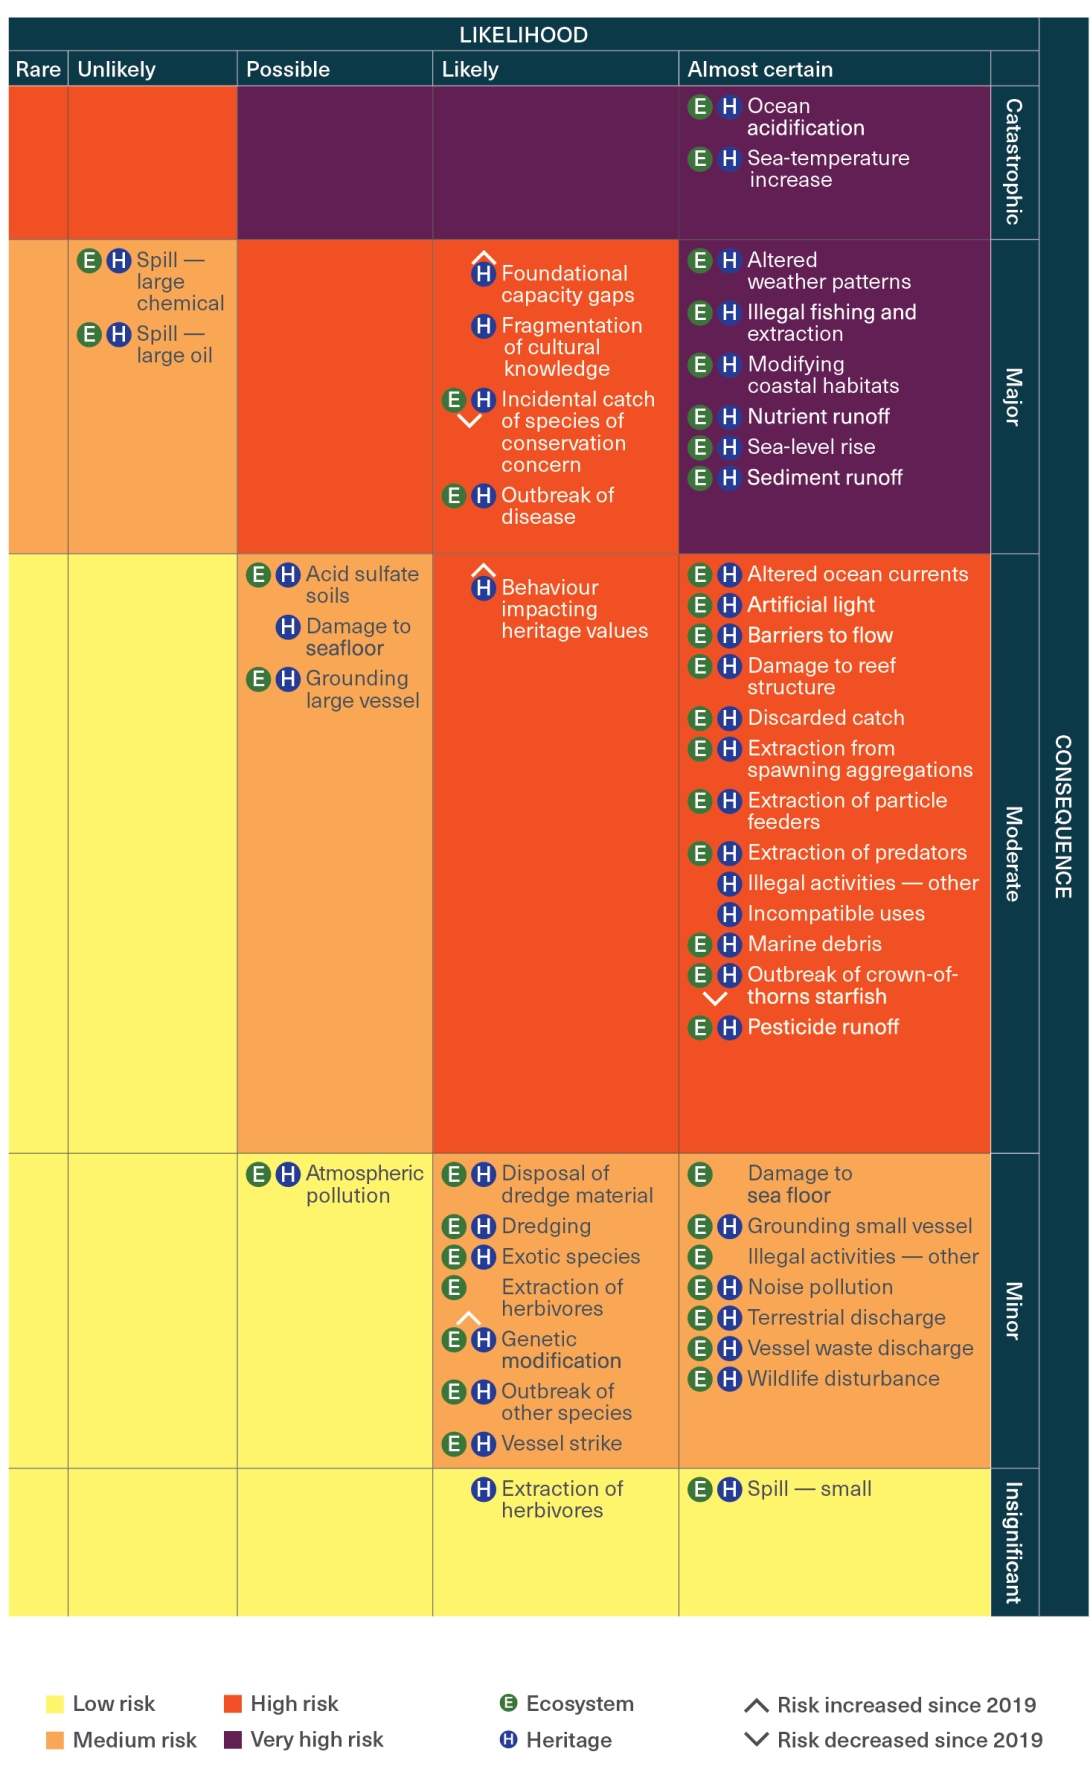
Figure 9.2
Risks to the Region’s ecosystem and heritage values from identified threats

This risk matrix is consistent with the principles, framework and processes outlined in the Australian Standard (AS ISO 3100) using terms and definitions detailed in Appendix 7. The assessment is based on current and documented future trends in the identified threats and existing management measures. The compounding effects of threats are not considered. The full description of each of the identified threats is provided in Appendix 6 and the risk assessment for each threat is summarised in Appendix 8. Symbols indicate where a threat has been assessed as having the same combination of likelihood and consequence ratings for both ecosystem and heritage values (that is, its natural, Indigenous, historic and other heritage values). If a threat has different ratings for ecosystem and heritage, it is presented twice and each entry is shown with a single symbol. Some threats are only relevant to heritage values and only appear once. If the assessed risk has increased or decreased since 2019, this is indicated. 

This risk matrix is consistent with the principles, framework and processes outlined in the Australian Standard (AS ISO 3100) using terms and definitions detailed in Appendix 7. The assessment is based on current and documented future trends in the identified threats and existing management measures. The compounding effects of threats are not considered. The full description of each of the identified threats is provided in Appendix 6 and the risk assessment for each threat is summarised in Appendix 8. Symbo
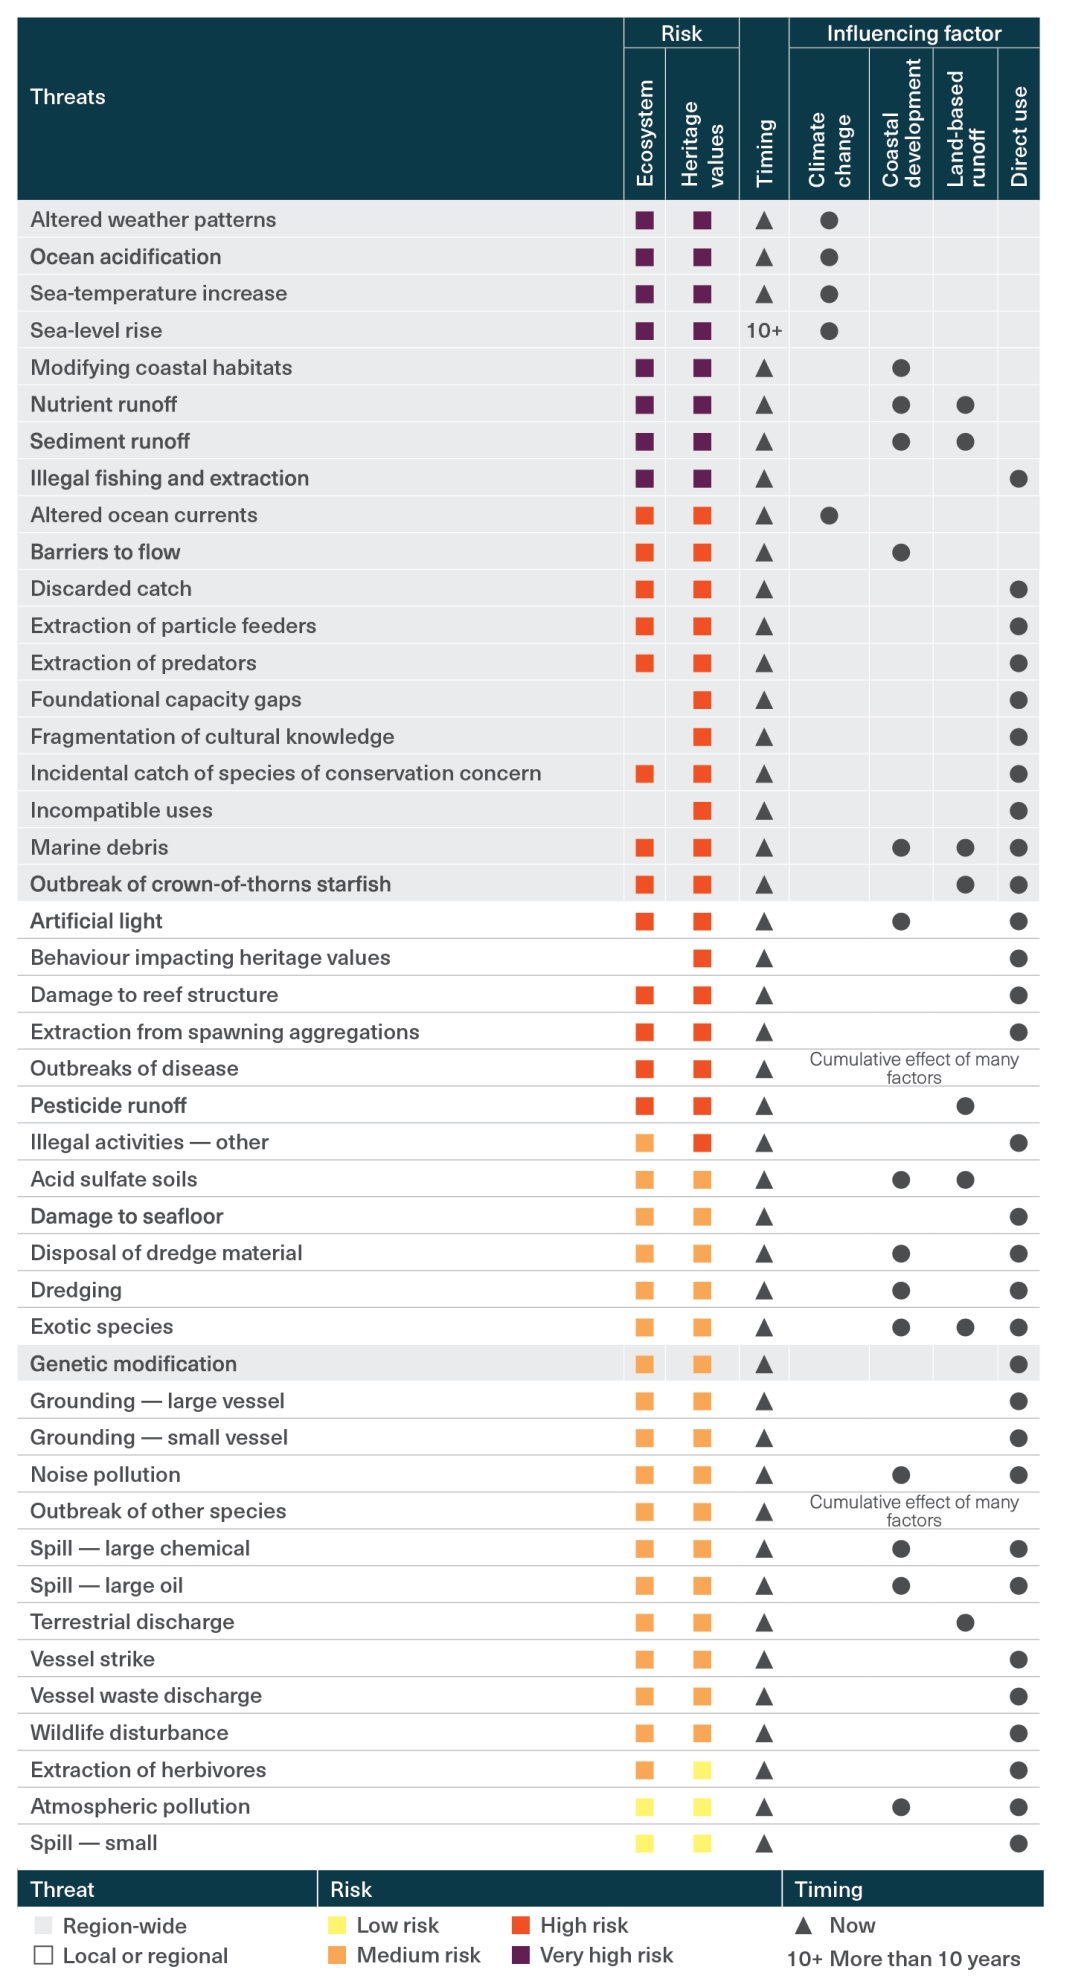
Figure 9.3
Summary of threats arising from factors influencing the Region’s values, and associated scale, timing and risk level

This figure links identified threats with the key factors (Chapter 6) that have the most influence on them (indicated by the black dots), either directly or indirectly. Instances where a factor is likely to only have an insignificant influence on a threat are not displayed (no dot shown). The risk level for each threat is shown, along with the scale of the risk and expected timing of the effects of the threat.

This figure links identified threats with the key factors (Chapter 6) that have the most influence on them (indicated by the black dots), either directly or indirectly. Instances where a factor is likely to only have an insignificant influence on a threat are not displayed (no dot shown). The risk level for each threat is shown, along with the scale of the risk and expected timing of the effects of the threat.
References
  • 541. Cheal, A.J., MacNeil, M.A., Emslie, M.J. and Sweatman, H. 2017, The threat to coral reefs from more intense cyclones under climate change, Global Change Biology 23(4): 1511-1524.
  • 554. Yaddanapudi, R., Mishra, A., Huang, W. and Chowdhary, H. 2022, Compound wind and precipitation extremes in global coastal regions under climate change, Geophysical Research Letters 49(15): e2022GL098974.
  • 608. Fox-Kemper, B., Hewitt, H.T., Xiao, C., Aðalgeirsdóttir, G., Drijfhout, S.S., et al. 2021, Ocean, Cryosphere and Sea Level Change, in Climate Change 2021: The Physical Science Basis. Contribution of Working Group I to the Sixth Assessment Report of the Intergovernmental Panel on Climate Change, eds V. Masson-Delmotte, P. Zhai, A. Pirani, S.L. Connors, C. Péan, et al., Cambridge University Press, Cambridge and New York, pp. 1211–1362.
  • 644. Oliver, E.C., Donat, M.G., Burrows, M.T., Moore, P.J., Smale, D.A., et al. 2018, Longer and more frequent marine heatwaves over the past century, Nature Communications 9(1): 1-12.
  • 657. Gregoire, M., Gilbert, D., Oschlies, A. and Rose, K. 2019, What is ocean deoxygenation? in Ocean deoxygenation: Everyone’s problem - Causes, impacts, consequences and solutions, eds D. Laffoley and J.M. Baxter, IUCN, Switzerland, pp. 1-21.
  • 1539. Trewin, B., Morgan-Bulled, D. and Cooper, S. 2021, Australia State of the Environment 2021: Climate. Independent report to the Australian Government Minister for the Environment, DCCEEW, Canberra.
  • 1604. Hughes, T.P., Anderson, K.D., Connolly, S.R., Heron, S.F., Kerry, J.T., et al. 2018, Spatial and temporal patterns of mass bleaching of corals in the Anthropocene, Science 359(6371): 80-83.
  • 1615. Jokiel, P.L. and Coles, S.L. 1990, Response of Hawaiian and other Indo-Pacific reef corals to elevated temperature, Coral Reefs 8: 155-162.
  • 1665. Byrne, M. 2011, Impact of ocean warming and ocean acidification on marine invertebrate life history stages: Vulnerabilities and potential for persistence in a changing ocean, Oceanography and Marine Biology: An annual review 49: 1-42.