Queensland’s economy is driven primarily by tourism, agriculture, mining, construction, manufacturing and services.1494 It has maintained an average annual growth rate of 2.2 per cent over the past decade.1494
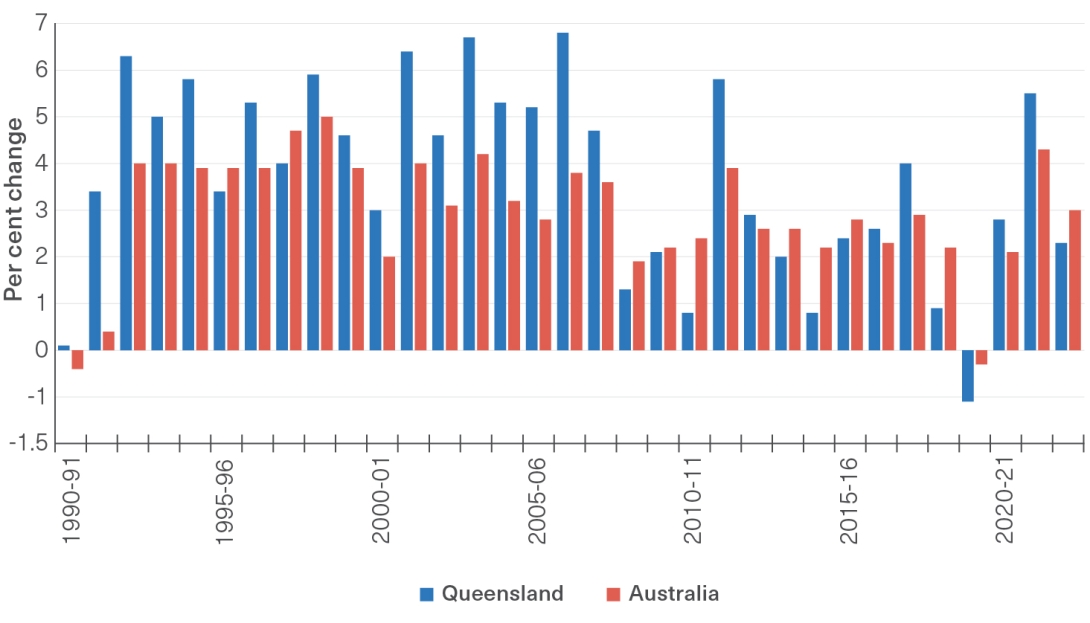
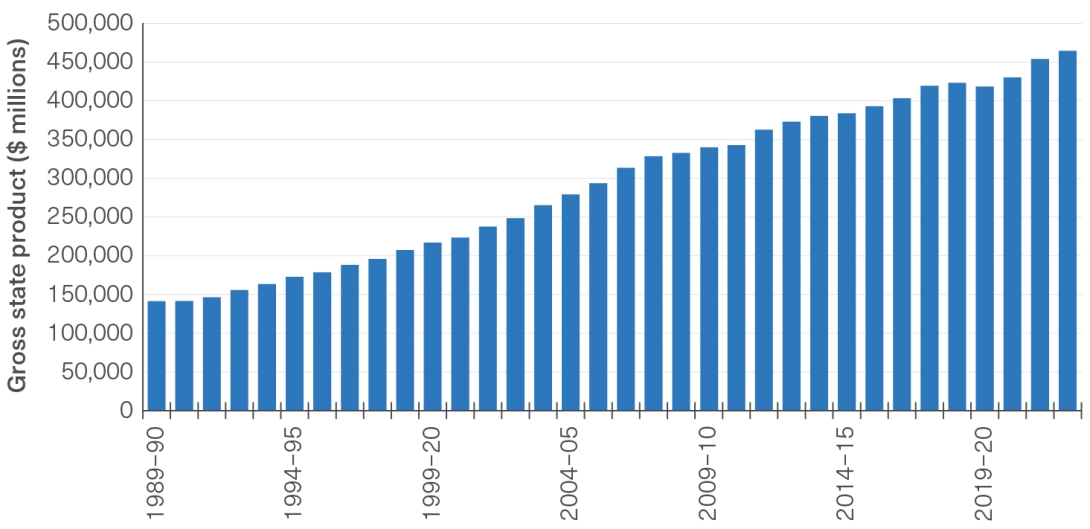
In the 2019–20 financial year, Australian gross domestic product and Queensland gross state product fell by 0.3 and 1.1 per cent, respectively (Figure 6.2).1494 This was Queensland’s first fall in recorded history and it was due to adverse impacts from the COVID-19 pandemic and related containment measures.1494,1495 In 2022–23, Australian gross domestic product increased by 3 per cent, following growth of 2.1 and 4.3 per cent in the 2020–21 and 2021–22 financial years, respectively. Similarly, Queensland gross state product increased by 2.3 per cent, following growth of 2.8 and 5.5 per cent in the 2020–21 and 2021–22 financial years, respectively. In 2022–23, Queensland had a gross state product of $464 billion (Figure 6.3), the third highest in the nation after New South Wales and Victoria.1494 Queensland had less disruption from the COVID-19 pandemic than other eastern states, experiencing no major lockdowns. This provided additional stimulus to many industries. In the 3 years following the COVID-19 crisis, the contributors to Queensland economic growth, as measured using an economic productivity metric called ‘gross value added’, were: agriculture, forestry and fishing; professional, scientific and technical services; and, health care and social assistance.1494
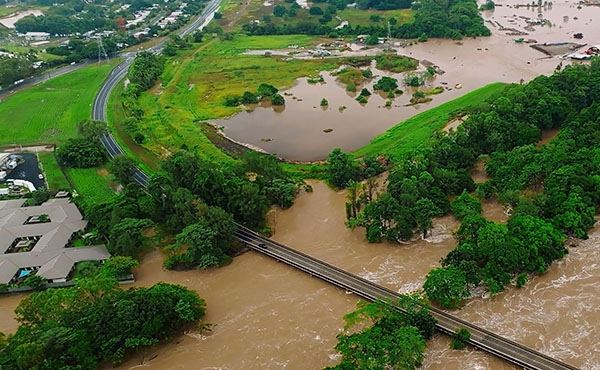
A significant proportion of Queensland’s economic activity takes place within the Region and its Catchment, particularly agriculture, forestry and fishing, mining and tourism.1494 As measured by the gross value added metric in each financial year, agriculture, forestry and fishing rose by 21.9 per cent in 2020–21, by 20.8 per cent in 2021–22 and by 8.9 per cent in 2022–23.1494 Strong agricultural production across livestock products, cotton and grains was helped by favourable weather conditions. The impacts from floods in February and March 2022 were localised and did not significantly affect overall production.1494
Mining activity made up 11.7 per cent of the Queensland economy in 2019–20.1496 Queensland’s coal and bauxite reserves are among the largest in the world and are high grade, making them a sought-after product overseas. Also measured by the gross value added metric by financial year, mining fell by 8.1 per cent in 2020–21, by one per cent in 2021–22 and by 4 per cent in 2022–23.1494 The global recession caused by the COVID-19 pandemic has lowered demand for Queensland’s key exports, particularly coal and liquified natural gas and, as a result, prices have fallen significantly.
Tourism is the Reef’s largest economic activity (Section 5.2). In the 2018–19 financial year, the tourism market across Queensland as a whole contributed $12.7 billion to the state economy and was the second largest in Australia, accounting for 22.7 per cent of national tourism output.1496,1497 The COVID-19 pandemic and its associated travel restrictions had a devastating impact on Queensland’s international tourism.1496 International tourism expenditure dropped from its height of $6.1 billion in December 2019 to an all-time low of $89 million in January 2021. The international border reopened in early 2022, bringing a steady increase in international visitor arrivals;1498 however international tourism expenditure has not fully recovered to 2019 levels, reaching $3.6 billion in January 2023.1499 Forecasts predict the international spend in Australia will exceed pre-pandemic levels in 2024.1177
Domestic tourism expenditure dropped from $19.4 billion in December 2019 to $12.1 billion in January 2021.1499 However, Australians responded by travelling more in Australia.1498 In January 2023, domestic tourism expenditure reached $29.3 billion, surpassing 2019 levels.1499 Within the tourism regions adjacent to the Reef, the Tropical North Queensland region had a very significant increase in domestic tourism expenditure, primarily due to Cairns being the point of origin for most domestic visitors to the Reef and the primary destination of international visitors.1499
Economic output of Australia’s marine industry continued to grow despite the effect of the COVID-19 pandemic restrictions on some subsectors. In the 2020–21 financial year, Queensland accounted for 14 per cent of the total output of the Australian marine industry, with an output of $16.2 billion, driven mostly by domestic marine tourism, and water transport and ports.1198
Following a strong rebound after the COVID-19 crisis, the Queensland economy was forecast to grow by 2 per cent in the 2022–23 financial year, driven by an ongoing rebound in tourism and education services exports, with growth forecast to strengthen to 3 per cent in 2023–24.1500 However, the global economy faces increased uncertainty and volatility with risks to the outlook skewed to the downside. The International Monetary Fund downgraded its global growth outlook for 2023, reflecting the sharp interest rate rises required to curb inflation, deterioration in financial conditions, the impacts of the Russia–Ukraine conflict and rising geopolitical tensions.1500 Similar to the global economy, national economic growth is expected to slow in coming years, weighed down by slowing growth in consumption, public spending and exports according to the Reserve Bank of Australia. National gross domestic product growth slowed from 2.7 per cent in 2022 1501 to 1.5 per cent in 2023,1502 but it is expected to increase gradually to 1.8 per cent by the end of 2024.1503


