6.4.1 Trends in coastal development

Agriculture

Despite global and local disruptions due to the COVID-19 pandemic 1737 and a short period of decreased growth, the total value of Queensland’s agriculture has rebounded. It is estimated at $24 billion in the 2023–24 financial year, 6.8 per cent greater than the average for the past 5 years.1738 Many of the important agricultural industries in the Catchment are at historical highs, particularly beef, bananas and cotton, which have all recorded their highest annual production numbers and land use areas since 2010.1734 

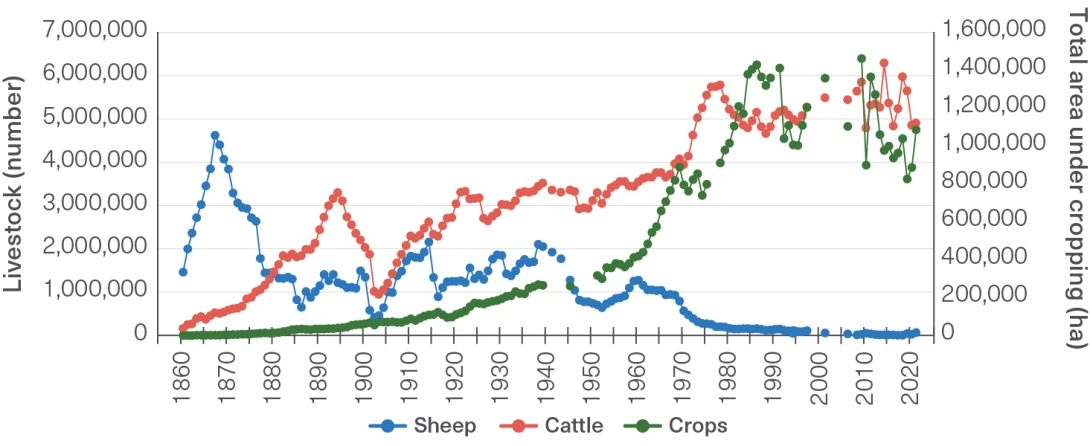
The total land area under cropping in the Catchment was 1,086,754 hectares (10,867 square kilometres) in 2021, dominated by grain crops and sugar cane (Figure 6.10). This area is less than it has been in the past, mainly driven by cropping declines in the Fitzroy and Burnett Mary natural resource management (NRM) regions from historical highs in the late 1900s. Other NRM regions have steadily increased in area under cropping and are currently at or around their historical maximums.1734 

A herd of cattle in long grass with trees in background
Beef cattle grazing in the Fitzroy region. © Queensland Government 2013

Between 2018 and 2021, agricultural land uses accounted for the greatest areas of vegetation clearing in the Catchment. The motivations for clearing on agricultural land are to maintain or increase productivity, to maintain or increase the market value of the land, or to harvest fodder.1739 On grazing lands in the Catchment, 440,829 hectares (4408 square kilometres) of vegetation were fully cleared and 39,946 hectares (399 square kilometres) were partially cleared between 2018 and 2021.1740

Agricultural land uses account for the greatest areas of catchment vegetation clearing

Vegetation management laws passed by the Queensland Government in 2018 regulate clearing in order to: conserve remnant vegetation and regrowth along waterways in all catchments; minimise land degradation; maintain ecological processes; and prevent the loss of biodiversity.1741 By 2020–21, this change had led to a 24 per cent reduction in overall land clearing rates in the Catchment when compared to 2018–19.2171,2172 The loss of riparian woody vegetation in the Catchment, often linked to agricultural uses, was 47,519 hectares (475 square kilometres). Most of this loss occurred in the Fitzroy, Burnett Mary and Burdekin regions and the bulk of this clearing was lawful.951

Ground cover levels in the Catchment are strongly influenced by the timing and amount of rainfall across the Catchment, and they have varied substantially since 2019. In 2020, 35 per cent of grazing lands within the Catchment had insufficient late-dry-season ground cover for effective erosion control, driven in large part by low levels in the Burdekin and Fitzroy regions.1741 In 2022, this had dropped to 8 per cent.951

Trends in agricultural land management practices that affect water quality are examined in the land-based runoff section (Section 6.5). 

Figure 6.10
Agricultural data time series for the Great Barrier Reef Catchment area

Numbers of cattle, sheep, and total area under cropping (ha) between 1860 and 2021 for the Great Barrier Reef Catchment area. The key crops that dominate the total cropping series are grain crops and sugar cane. Source: Adapted from Lewis et al. (2021)1734 

Line graph showing total numbers of sheep (depicted by a blue line), cattle (red line) and area under crops (green line) within the Catchment. X-axis shows years between 1860 and 2021. Two separate y-axes are shown: number of livestock on the left and total area under cropping in hectares on the right.

Mining and resources

Queensland has rich endowments of mineral and energy resources and is a major global producer of high-quality coal. The Catchment includes the Bowen Basin, which is the most important coal-bearing region in Queensland. The resource sector has been a key contributor to the Queensland economy and was worth more than $74 billion in the 2021–22 financial year,1494 accounting for nearly one-fifth of the Queensland economy. The sector continues to be a key source of employment, with nearly 71,000 people directly employed in the sector on average in 2022–23.1742 

The resources sector continues to be a key source of employment and revenue

Queensland’s annual exploration expenditure has increased from $436 million in 2015–16 to $771 million in 2022–23, driven by both coal and mineral exploration.1743 However, the number of exploration permits for coal declined by 40 per cent over the same period, while the number of mineral development licences for coal increased slightly since 2015–16. In 2022–23, around 85 per cent of coal-related exploration permits for coal and mineral development licences with a granted status were located in the Great Barrier Reef Catchment.1744

Statewide, coal production (coking and thermal net output) has declined from an average of approximately 243 million tonnes per annum between 2015–16 and 2019–20, to approximately 220 million tonnes in 2021–22.1744 The number of operating coal mines has remained roughly stable with between 52 and 55 operational mines in the financial years between 2015–16 and 2021–22. Of the 54 operating coal mines in Queensland in 2021–22, 49 were in the Reef Catchment producing 135.4 million tonnes of metallurgical coal and 68.6 million tonnes of thermal coal.1744

In 2023, the proposed Central Queensland Coal Project was refused under the Environmental Protection and Biodiversity Conservation Act 1999 (Cth) (EPBC Act) due to unacceptable risks from increased sediment loads to the Great Barrier Reef World Heritage Area, Great Barrier Reef National Heritage Place and Great Barrier Reef Marine Park.1745 This is the first rejection of a coal mine in the Catchment under national environmental law. Multiple legal challenges to applications and approvals for coal mines in the Catchment, including since 2019, have been based on direct impacts to the Great Barrier Reef and on the broader contribution of coal mines to the drivers of climate change.1746,1747

Urban and industrial development

Urban and industrial development occupies a small proportion, 1.1 per cent, of the Catchment.1735 These highly modified environments create downstream impacts, including the generation of sediment and nutrient inputs that enter the Region through point source releases, and diffuse runoff (Section 6.5). While urban and industrial point source releases are regulated, diffuse runoff remains difficult to quantify and regulate.

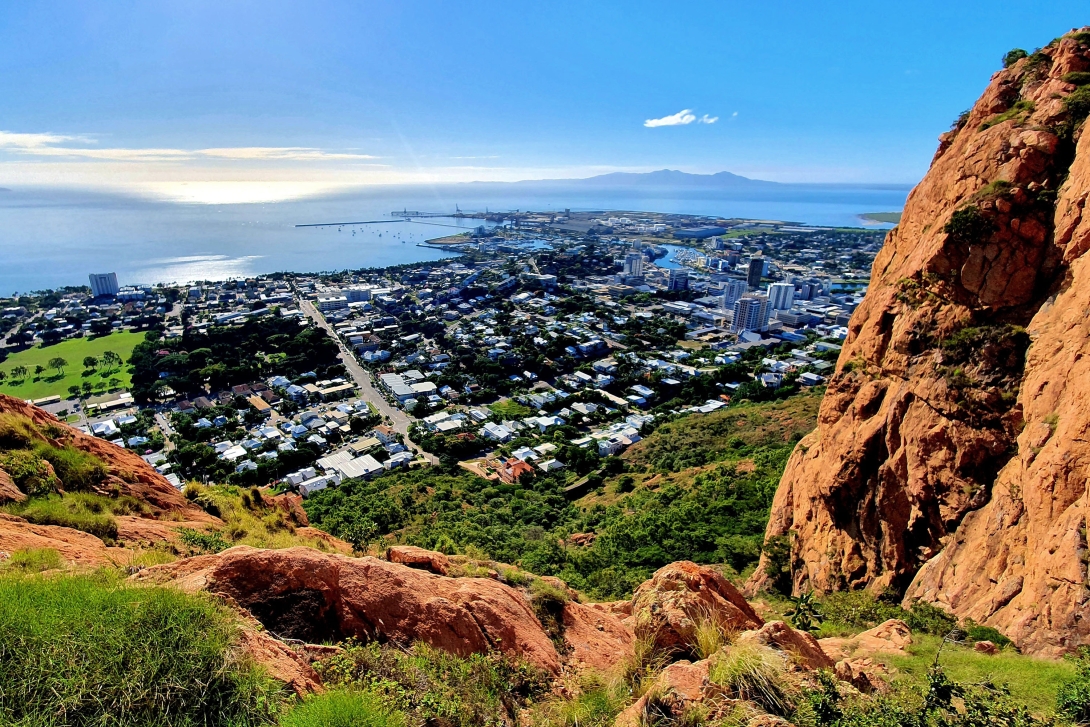
Looking down on Townsville city centre and sea from near the top of Castle Hill, with sunlit red cliff in foreground.
Urban centres can have downstream impacts on the Reef's ecosystems, Townsville City. © Nick O'Carroll 2020

Overall, the impact on water quality and Reef condition is considered localised and is generally restricted to major urban centres such as Townsville and Cairns. Diffuse urban runoff is also a lower threat than runoff from other major land uses, such as agriculture, due to its relatively small per cent contribution to total load (Section 6.5.1),40,1748 and given the established regulatory framework for urban and industrial development (Section 6.5). The increasing impact of land-based marine debris, much of which is derived from urban and industrial areas, is an ongoing concern and considered in Section 6.5

Artificial light affects Reef species and the coastal environment

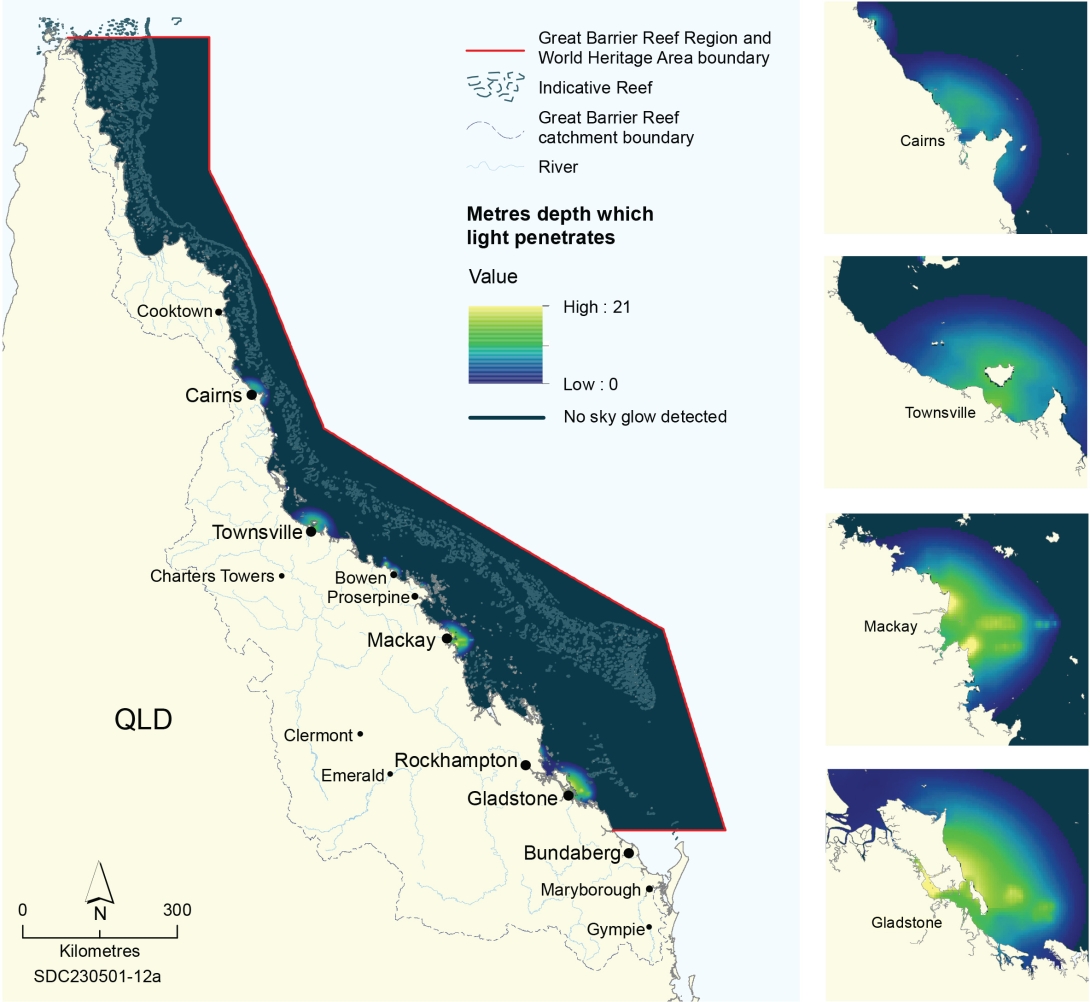
Artificial light from coastal urban and industrial infrastructure has impacts on the coastal environment that is directly illuminated (nearfield effects). Artificial light pollution from coastal urban areas, industry, ports and marinas also generates an artificial skyglow that is bright enough to elicit biological responses in surrounding marine habitats kilometres from the actual source (Figure 6.11).1749 Biologically meaningful artificial light pollution may cause impacts at depths greater than 1 metre across approximately 13,000 square kilometres of the Reef, depending on the month. During June, July, August and September, these light impacts tend to penetrate deeper waters due to higher water clarity. In February, March and April, these light impacts are usually confined to shallower depths due to lower water clarity.1750 Trends in the extent and depth of light pollution are currently not available. The near-field effects of artificial light from sources such as ports, marinas and ships in anchorages remain a knowledge gap.

Figure 6.11
Modelled depth at which biologically meaningful light pollution can be detected across the Region in August

This image excludes impact of direct illumination. Inset panels depict the impact of light pollution from Cairns, Townsville, Mackay and Gladstone. Source: Derived from Smyth et al. (2021)1750

A map of the Region with sea areas shaded along a blue to green to yellow colour gradient to show light pollution, measured as the light penetration depth in metres. A scale bar indicates the range in modelled light penetration from 0 (dark blue) through to 21 metres at the high end (yellow). Light pollution is evident in areas immediately adjacent to Cairns, Townsville, Mackay and Gladstone.

Sewage treatment plants

About 60 gigalitres of treated sewage is released in the Catchment’s coastal waters annually, with yearly volumes fluctuating between 66 and 46 gigalitres.1751 Nitrogen and phosphorus are present in treated sewage. Improvements at treatment plants have significantly reduced nitrogen and phosphorus concentrations in treated sewage released into the Catchment. Overall, average concentrations of nitrogen and phosphorus have fallen between 2016 and 2019 (Table 6.1). Between 2010 and 2019, the annual total load of nitrogen released from sewage treatment plants fell from around 330 to 223 tonnes. Total phosphorus load fell from 95 tonnes in 2017 to 60 tonnes in 2019.1751 

Table 6.1
Total average concentrations of nitrogen and phosphorus from treated sewage released into the Region

Source: Queensland Department of Environment and Science, (2021)1751

 20162019
Average nitrogen concentration (milligrams per litre)4.7 mg/L3.7 mg/L
Average phosphorus concentration (milligrams per litre)1.6 mg/L1 mg/L

A high level of nutrient treatment is being achieved at sewage facilities

Based on the monitoring of discharge locations, 50 per cent of council sewage treatment plants are achieving better than 3.3 milligrams per litre total nitrogen and 0.71 milligrams per litre total phosphorus, suggesting a high level of nutrient treatment is being achieved at these facilities.1752 Overall, the modelled contribution of sewage treatment plants to anthropogenic dissolved inorganic nitrogen loads to the Region is minor (1.8 per cent) compared with other sources.1748 The downstream impacts of sewage treatment plants, such as nutrient loads, are subject to water quality targets set out under the Reef protection regulations, and facilities may adopt offset schemes to meet targets. However, a systematic understanding is lacking about the contribution of septic systems to nutrient loads.

Barriers to flow

Barriers across rivers and channels, such as weirs and dams, change the upstream and downstream hydrology and ecology of systems.1753 Barriers over land, such as bund walls, levees, roads and rail infrastructure, disconnect large areas of habitat.1754 Structures of all sizes that impede water flow have an influence on waterway condition and function. Almost all estuary–wetland systems, in all but the most northern catchments, have been affected by barriers to flow.1754 

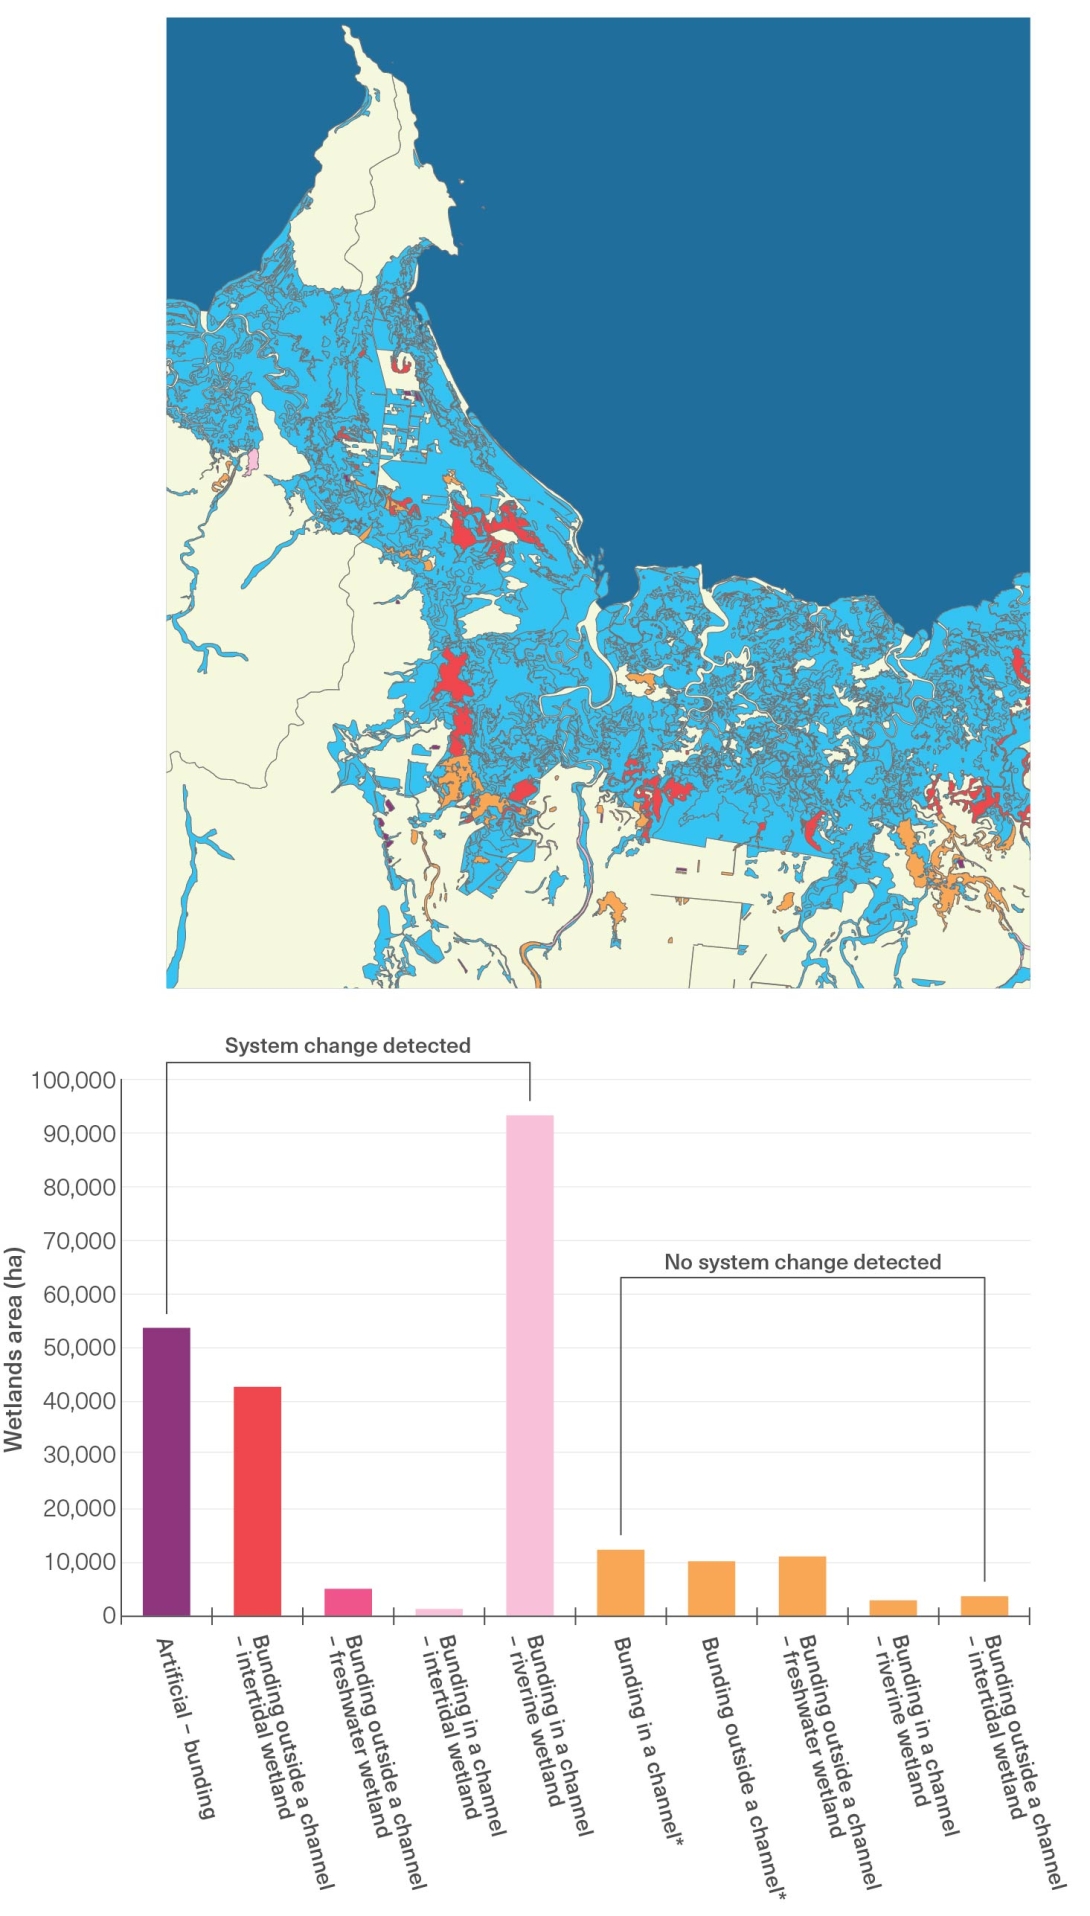
In 2019, 236,751 hectares (2368 square kilometres) of wetland were in a state modified by barriers in the Catchment and adjacent intertidal areas. More than half (142,735 hectares or 1427 square kilometres) of this wetland area has changed from one wetland type to another as a result of these barriers, including 93,571 hectares (936 square kilometres) of lacustrine systems that were originally riverine systems and 42,826 hectares (428 square kilometres) of freshwater wetlands that were originally intertidal wetlands (saltmarsh, saltflats and mangroves) (Figure 6.12).1755

Limiting fish movement across the landscape, through originally connected systems, is a key impact of barriers to flow. Some instream structures, such as high-velocity pipes and culverts that do not present major barriers to hydrological connectivity, can still present a barrier to fish migration. Fish passage barriers have not been systematically recorded across the Catchment, and this remains a knowledge gap. Detailed mapping has occurred across some regions,1756 and for Ramsar Wetlands.1757 Impacts differ substantially among regions. In the Wet Tropics region, most river basins are relatively free from impoundments; however, substantial lengths of the Barron and Tully rivers are impounded.128 In the Mackay Whitsunday region, all basins except for the Don River are in a ‘moderate’ or ‘poor’ state in relation to fish barriers. The impoundment condition of the Proserpine River recently declined to ‘poor’.1758 Recent assessments have found more than one potential fish barrier per square kilometre in both the Murray and Lower Herbert rivers and the Mackay Whitsunday basins.1759,1760

Works are continuing in the Catchment to restore hydrological and ecological connectivity. Works include removing barriers for large-scale restoration of natural hydrology to wetland ecosystems. Examples include causeway removals to restore the Rodd’s Harbour Fish Habitat Area, Rodds Peninsula,1761 and bund wall removals at Mungalla Station.1762 These kinds of barrier removal works can provide long-term benefits. For example, the removal of a bund wall in the Mungalla wetlands in 2013 reinstated tidal connection, leading to major reductions in freshwater weeds, the reappearance of native vegetation, improvements in water quality and a tripling of fish diversity over a period of 4 years.938 In the Catchment, coordinated monitoring and evaluation of wetland restoration projects is lacking despite existing frameworks.1763

Figure 6.12
Wetland modifications caused by bunding, a barrier to flow

The total extent of bunded wetlands in the Catchment and adjacent intertidal areas in the Region is 236,751 hectares. The bar chart breaks down the total bunded area (hectares) by the ecosystem effects of that bunding. Asterisks (*) indicate that the status of system change is unknown. The map depicts a sample area of the Reef Catchment and Region — Bowling Green Bay and surrounds. The map colours match the categories in the bar chart and the light blue areas show wetlands where no bunding has been detected. The map excludes subtidal wetlands. Source: Queensland Department of Environment, Science and Innovation (2023)1755

This figure comprises a map (top) and a bar graph (below). The map shows an example location within the Region, with land areas shaded to show system status. The bar graph includes ten categories of bunding along the x axis, separated in two main groups:  those where system change has been detected shown as red or pink bars and those where no system change has been detected shown as orange bars.

Work has also been carried out to enable fish passage. Fish passage works, such as fishways, do not necessarily ensure historical hydrological connectivity, but they usually make barriers more navigable during periods of flow. At least 127 waterway barriers with fishways existed in the Catchment in 2022.1764  An approvals process is in place to control new barriers to fish passage under the Planning Act 2016 (Qld) and Fisheries Act 1994 (Qld). This process results in new waterway barrier works having design elements that promote fish passage through or over the structure. Between 2018 and 2022, 326 development applications and 3332 accepted development requirement notifications were submitted for waterway barrier works in local government areas of the Great Barrier Reef Catchment.1765

Aerial image of a bitumen road crossing an intertidal wetland, a vehicle can be seen parked on the side of the road. There is an artificial channel letting some water pass underneath the road.
Road infrastructure creating a barrier to flow in an intertidal wetland, Cape Cleveland, QLD, Australia. © Nick O'Carroll 2024

While physical works represent substantial improvements at the scale of particular wetland systems, and legislative arrangements reduce the threat of uncontrolled installation of future barriers, legacy barriers remain a widespread impairment to the Reef ecosystem health.1754 

Tidal works

While quantifiable extent data are available for some works, comprehensive and systematic data on all tidal works and their cumulative impacts are lacking. In 2015, 9 per cent of the Region’s mainland coastline was estimated to have been modified by engineered structures.1766 Most structures occur in marina and port developments, with 60 per cent located within the lower 3 kilometres of estuaries.1766  Contemporary data since 2015 remain a knowledge gap. Beach nourishment and dune restoration are being actively pursued along parts of the coastline, including the Capricorn Coast, Mackay, Burdekin and the Cassowary Coast.1767 Tidal works, such as seawalls, marinas and port infrastructure, create novel marine habitats in the Region, and these urban–industrial seascapes can contain abundant fish communities,1768 though the effects of these structures at the wider population and community level remain difficult to determine.

Linear infrastructure

Privately and publicly owned roads, rail and tracks are types of linear infrastructure. They are not confined to built-up areas and are present across the Catchment.1769 This infrastructure can create a barrier to flow when they cross waterways, and alter flows overland during periods of flooding. New or upgraded roads make marine and coastal areas more accessible and can increase direct use of the Reef. Erosion from linear infrastructure has been identified as a significant sediment source within particular parts of the Catchment1770 and a vector for pests and weeds into remote coastal ecosystems. As of 2021, there were 87,437 kilometres of roads and 41,899 kilometres of tracks in the Catchment.1769 Unsealed roads can be a source of subsurface erosion, which is not currently accounted for in Reef sediment budgets.1771 Comparable data on the number and type of barriers to flow created by linear infrastructure across the Catchment are not available. In remote far northern parts of the Catchment, where a large proportion of roads are unsealed, linear infrastructure is potentially the most significant sediment source of any land use impact.1772 In 2021, there was 454 kilometres of linear infrastructure across tidal waterways, mostly local roads and tracks.1773,1769 The frequent transit of vehicles across intertidal areas causes physical and ecological damage, removing habitat-forming vegetation and altering animal assemblages.1774,1775

Aquaculture

Aquaculture can affect the marine ecosystem, particularly through the modification of coastal habitats and the water quality of point source releases, leading to, for instance, deoxygenation impacts.1777 Since 2018, Queensland-wide production value has increased dramatically, by approximately 90 per cent, from $118 million in 2018–19 to $225 million in 2021–22. This growth has occurred alongside an increase in the relative importance of aquaculture to Queensland’s total fisheries production.1318 The bulk of this value is derived from land-based aquaculture operations in central and northern Queensland, particularly in Cairns, Townsville and Mackay.1318 The most valuable sectors of the Queensland aquaculture industry continue to be prawn and barramundi.1318 

In 2021–22, the total ponded area in the Catchment was 990 hectares (9.9 square kilometres). Where increases in production have been made, in most cases they were achieved by intensification rather than expansion of farm footprint.1318 However, 9022 hectares (90 square kilometres) of land-based marine aquaculture development areas have been identified within the Catchment for the aquaculture industry in Queensland.

Since 2019, there has been an expansion of the Proserpine Prawn Farm in the Mackay Whitsunday region. Proposals to roughly triple the production pond footprint are under assessment under the EPBC Act.1778,1779 Seaweed production is being trialled in farms across the Catchment, including the Proserpine Prawn Farm1780 to reduce nutrients in wastewater discharge. 

No marine-based aquaculture facilities are currently operating in the Region. Recent developments in black lip oyster hatchery production indicate new potential for oyster farming activities to expand into and adjacent to the Region.1781 The downstream impacts of aquaculture, such as nutrient loads, are subject to water quality targets set out under the Reef protection regulations, and facilities may adopt offset schemes to meet targets. 

Port development

Port development undertaken directly in the Region is described and assessed in Section 5.7. Land-based aspects of port activities (above the low water mark, including reclamation) form part of the coastal development assessment. Land reclamation occurs when an area is restricted from tidal influence and converted into land above the high water mark.  Systematic reporting of land reclamation above the low water mark, and of historical land reclamation in the Region since European settlement for port and other purposes, remains a knowledge gap.

Point source pollutants from ports are regulated, and impacts on the Region are largely localised, but port activities continue to present a continued risk of point source pollution. Between 2019 and 2022,138 pollution incidents were reported within the port limits of Gladstone, Mackay, Townsville and Cairns.1782,1783,1784,1785 Coordinated data on the scale and impact of these incidents are not readily available. 

Marine access infrastructure

Marine access infrastructure and launch facilities, such as boat ramps, pontoons and marinas on islands, in rivers and on the mainland coast support local, recreational and tourism access to the Region. Since 2018, 2 new boat ramps have been installed in the Cairns region, 2 in the Mackay region and 3 in the Gladstone region. A new lane was also added to an existing location in the Cairns region, and upgrades were made to existing facilities in all regions 1786 (regions refer to Maritime Safety Queensland Regions). 

Seven new boat ramps have been installed to provide access to the Region

Along the Reef coast, the Whitsundays region has been identified as most in need of additional marine access facilities. In late 2023, the Queensland Government announced investment in marine infrastructure at Hook Island, Long Island and Keswick Island.1787,1788 While some of these facilities are outside the Region, impacts from installation and operation of these facilities may affect the values of the Region. 

Between 2019 and late 2023, a total of 161,475 cubic metres of material was dredged in activities associated with state-owned marine access infrastructure adjacent to or within the Region, including both capital and maintenance dredging.1789 Local governments and port authorities also own public marine access infrastructure in coastal areas adjacent to or within the Region, and they undertake mechanical maintenance activities of these facilities, though coordinated data are not readily available.

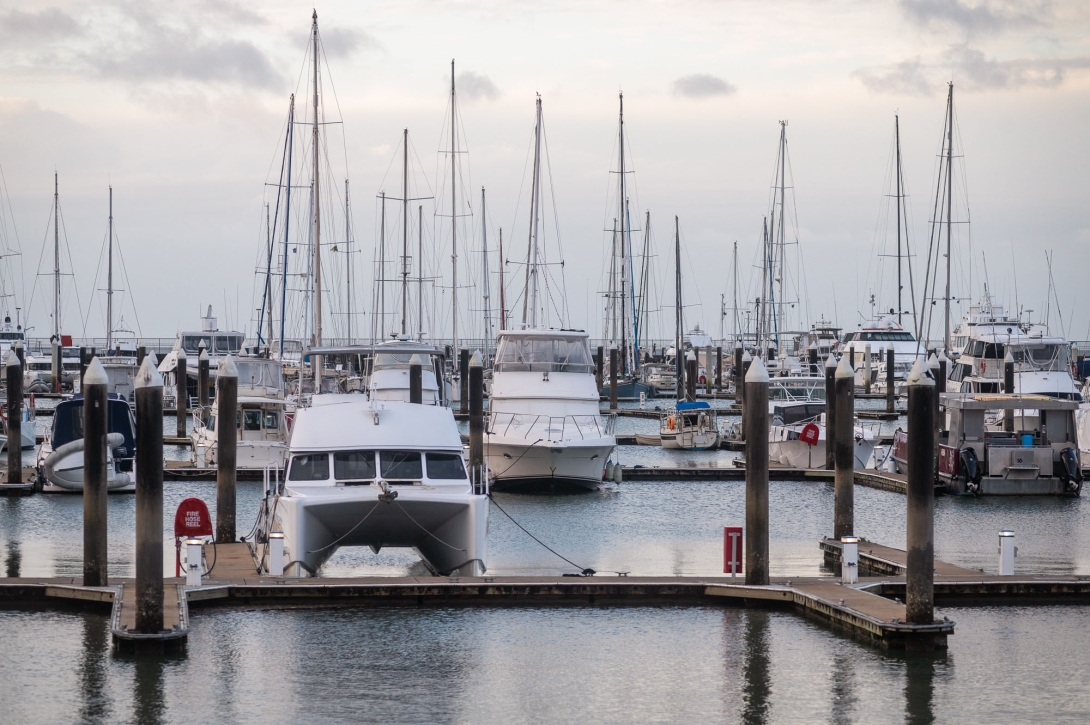
Sailing boats and motor yachts tied up on pontoons in a marina.
Cairns Marina. © Dieter Tracey 2024

Island development 

Most of the land area of the Region’s islands are natural landscapes. The remaining area is mainly occupied by forestry (147 square kilometres on Curtis Island) and grazing land (70 square kilometres, mostly on the islands of Broad Sound). Commercial and urban development (31 square kilometres) on some of the Region’s islands supports tourism resorts, port infrastructure around Townsville and Gladstone, and permanent residential populations.1735 The principal residential islands include Palm Island (2098 residents) and Magnetic Island (2475 residents), with relatively stable populations over time.1790 The Queensland Government plans to introduce new public facilities in protected areas on islands to enhance ecotourism.1791 This includes plans to rejuvenate resorts on Reef islands and build new public access jetties to increase visitors and encourage investment in new and existing island tourism operations.1792 For example, the proposed draft master plan for Woppa (Great Keppel Island) includes a new public plaza, jetty, cultural centre and supporting infrastructure.1793 Some decommissioned infrastructure, such as the underwater observatories on Green Island and Hook Island, has been actively removed.1794

References
  • 40. McCloskey, G.L., Baheerathan, R., Dougall, C., Ellis, R., Bennett, F.R., et al. 2021, Modelled estimates of fine sediment and particulate nutrients delivered from the Great Barrier Reef catchments, Marine Pollution Bulletin 165: 112163.
  • 128. Wet Tropics Waterways, 2. 2023, Wet Tropics Report Card 2023 reporting on data from July 2021 to June 22. Waterway Environments: Results, Wet Tropics Waterways and Terrain NRM, Innisfail.
  • 938. Abbott, B.N., Wallace, J., Nicholas, D.M., Karim, F. and Waltham, N.J. 2020, Bund removal to re-establish tidal flow, remove aquatic weeds and restore coastal wetland services—North Queensland, Australia, PLoS One 15(1): e0217531.
  • 951. The State of Queensland (Department of Environment and Science) and Australian Government 2024, Reef Water Quality Report Card 2021- 2022, DES, Brisbane.
  • 1318. State of Queensland 2022, Ross Lobegeiger report to farmers Aquaculture production summary for Queensland 2021-22, Department of Agriculture and Fisheries, Brisbane.
  • 1494. Australian Bureau of Statistics 2023, Australian National Accounts: State Accounts, <https://www.abs.gov.au/statistics/economy/national-accounts/australian-national-accounts-state-accounts/latest-release>.
  • 1734. Lewis, S.E., Bartley, R., Wilkinson, S.N., Bainbridge, Z.T., Henderson, A.E., et al. 2021, Land use change in the river basins of the Great Barrier Reef, 1860 to 2019: A foundation for understanding environmental history across the catchment to reef continuum, Marine Pollution Bulletin 166: 112193.
  • 1735. Department of Environmental and Science 2023, Land use mapping - 2021 - Great Barrier Reef NRM regions. <https://www.data.qld.gov.au/dataset/2021_great_barrier_reef_land_use>
  • 1737. Australian Bureau of Statistics 2023, ABS State Details, June quarter 2023, <https://www.abs.gov.au/articles/cumulative-economic-impact-covid-19-states-and-territories>.
  • 1738. State of Queensland, Department of Agriculture and Fisheries 2023, DataFarm Primary Industries data, <https://www.daf.qld.gov.au/news-media/campaigns/data-farm/primary-industries>.
  • 1739. State of Queensland (Office of the Queensland Chief Scientist) 2023, Native Vegetation Scientific Expert Panel report #32504, January 2023, Office of the Queensland Chief Scientist, Brisbane.
  • 1740. Department of Environmental and Science 2023, Landcover replacement class of woody vegetation change in Queensland in 2020-21, by Great Barrier Reef (GBR) region and non-GBR region, DES, Brisbane.
  • 1741. The State of Queensland (Department of Environment and Science) 2022, Reef Water Quality Report Card 2020, <https://reportcard.reefplan.qld.gov.au/>.
  • 1742. Australian Bureau of Statistics 2023, Labour Force, Australia, Detailed, Australian Bureau of Statistics. <https://www.abs.gov.au/statistics/labour/employment-and-unemployment/labour-force-australia-detailed/latest-release.>
  • 1743. Australian Bureau of Statistics 2023,  Mineral and Petroleum Exploration, Australia, <https://www.abs.gov.au/statistics/industry/mining/mineral-and-petroleum-exploration-australia/latest-release>.
  • 1744. Department of Resources 2023, 'Mining and resources statistics for the Great Barrier Reef - as reported to the Department of Resources (unpublished)'. Unpublished report.
  • 1745. Saint-Amand, A., Grech, A., Choukroun, S. and Hanert, E. 2022, Quantifying the environmental impact of a major coal mine project on the adjacent Great Barrier Reef ecosystems, Marine Pollution Bulletin 179: 113656.
  • 1746. The University of Melbourne 2024, Australian and Pacific Climate Change Litigation Database, <https://law.app.unimelb.edu.au/climate-change/case.php?id=&keyWord=great+barrier+reef>. 
  • 1747. Setzer, J. and Higham, C. 2022, Global Trends in Climate Change Litigation: 2022 Snapshot, Grantham Research Institute on Climate Change and the Environment and Centre for Climate Change Economics and Policy, London School of Economics and Political Science., London.
  • 1748. McCloskey, G.L., Baheerathan, R., Dougall, C., Ellis, R., Bennett, F.R., et al. 2021, Modelled estimates of dissolved inorganic nitrogen exported to the Great Barrier Reef lagoon, Marine Pollution Bulletin 171: 112655.
  • 1749. Patterson, M.A., Webster, J.M., Hutchings, P., Braga, J., Humblet, M., et al. 2020, Bioerosion traces in the Great Barrier Reef over the past 10 to 30 kyr, Palaeogeography, Palaeoclimatology, Palaeoecology 542: 109503.
  • 2171. Queensland Government 2023, 2020-21 Statewide Landcover and Trees Study (SLATS) report, Brisbane.
  • 2172. Queensland Government 2021, 2018-19 Statewide Landcover and Trees Study (SLATS) report, Brisbane.
  • 1750. Smyth, T.J., McKee, D. and Davies, T.A. 2021, A global atlas of artificial light at night under the sea, Elementa Science of the Anthropocene 9(1).
  • 1751. The State of Queensland, Department of Environment and Science 2021, Volume and load of sewage treatment plants, <https://www.stateoftheenvironment.des.qld.gov.au/pollution/water-quality/volume-and-load-of-sewage-treatment-plants#region-great-barrier-reef>.
  • 1752. Ramsay, I., Sudarjanto, G., Claus, S., Clech-Goods, C. and Munns, T. 2020, Great Barrier Reef point source metadata collection project final report, Environmental Monitoring and Assessment Science, Science Division & Technology Department of Environment and Science, Brisbane.
  • 1753. Waterhouse, J., Brodie, J., Lewis, S. and Audas, D. 2016, Land-sea connectivity, ecohydrology and holistic management of the Great Barrier Reef and its catchments: time for a change, Ecohydrology & Hydrobiology 16(1): 45-57.
  • 1754. Sheaves, M., Brookes, J., Coles, R., Freckelton, M., Groves, P., et al. 2014, Repair and revitalisation of Australia׳s tropical estuaries and coastal wetlands: Opportunities and constraints for the reinstatement of lost function and productivity, Marine Policy 47: 23-38.
  • 1755. Department of Environment and Science 2023, Queensland Wetland Data Version 6.0, Queensland Wetlands Program, Queensland Government, Brisbane.
  • 1756. Lawrence, M., Sully, D., Beumer, J. and Couchman, D. 2009, Targeted collection of inventory data for wetlands fish barriers of the Great Barrier Reef catchment, Department of Primary Industries and Fisheries, Brisbane.
  • 1757. Department of Employment, Economic Development and Innovation 2011, Inventory of instream structures impacting on Ramsar Wetlands, Queensland Wetlands Program, Brisbane.
  • 1758. Mackay-Whitsunday-Isaac Healthy Rivers to Reef Partnership 2023, Mackay-Whitsunday-Isaac 2022 Report Card reporting on waterway health data collected between July 2021 and June 2022, Mackay-Whitsunday-Isaac Healthy Rivers to Reef Partnership, Proserpine.
  • 1759. Moore, M. 2015, Mackay Whitsunday fish barrier prioritisation, Catchment Solutions Pty Ltd, Mackay.
  • 1760. Moore, M., Fries, J. and Power, T. 2021, Fish barrier prioritisation – Murray and Lower Herbert Rivers, Catchment Solutions Pty Limited, Mackay.
  • 1761. Department of Environment Science and Innovation, Queensland 2021, Rodds Peninsula Causeway Removals, Queensland Government, <https://wetlandinfo.des.qld.gov.au/wetlands/resources/tools/wetland-project/rodds-peninsula-causeway-removals-a9da/>.
  • 1762. Department of Environment Science and Innovation 2021, Reef Aid - Palm Creek and Mungalla, Queensland Government, <https://wetlandinfo.des.qld.gov.au/wetlands/resources/tools/wetland-project/reef-aid-palm-creek-and-mungalla-b2c2/>.
  • 1763. Department of Environment and Science 2022, Wetland Condition Assessment Tool (WetCAT): A Condition Assessment Tool for Measuring Event Recovery and Rehabilitation in Palustrine and Lacustrine Wetlands in Queensland, Version 1.0, June 2022, Queensland Government, Brisbane.
  • 1764. Department of Environment and Science 2022, Queensland aquatic fauna passage structures (biopassage), Queensland Government, Brisbane.
  • 1765. Department of Agriculture and Fisheries 2024, 'Unpublished data: Waterway Barrier Works Applications and Notification'. Unpublished report.
  • 1766. Waltham, N.J. and Sheaves, M. 2015, Expanding coastal urban and industrial seascape in the Great Barrier Reef World Heritage Area: Critical need for coordinated planning and policy, Marine Policy 57: 78-84.
  • 1767. Richards, S. 2021, NbS Benchmark Assessment Report, BMT Commercial Australia Pty Ltd, Cairns.
  • 1768. Bradley, M., Sheaves, M. and Waltham, N.J. 2023, Urban-industrial seascapes can be abundant and dynamic fish habitat, Frontiers in Marine Science 9: 1034039.
  • 1769. Department of Resources 2021, Queensland roads and tracks, <https://www.data.qld.gov.au/dataset/queensland-roads-and-tracks>.
  • 1770. Bartley, R., Waters, D., Turner, R., Kroon, F., Wilkinson, S., et al. 2017, Scientific Consensus Statement 2017: A Synthesis of the Science of Land-based Water Quality Impacts on the Great Barrier Reef, Chapter 2: Sources of sediment, nutrients, pesticides and other pollutants to the Great Barrier Reef, State of Queensland, Brisbane.
  • 1771. Brooks, A., Daley, J. and Pietsch, T. 2024, 2022 Scientific Consensus Statement: Summary | Evidence Statement for Question 3.6: What is the effectiveness of gully and streambank restoration works in reducing sediment and particulate nutrient loss from the GBR catchments, does this vary spatially or in different climatic conditions? What are the costs and cost-effectiveness of these works, and does this vary spatially or in different climatic conditions? What are the production outcomes of these practices? in 2022 Scientific Consensus Statement on land-based impacts on Great Barrier Reef water quality and ecosystem condition, eds J. Waterhouse, M. Pineda and K. Sambrook, Commonwealth of Australia and Queensland Government.
  • 1772. Cape York Natural Resource Management and South Cape York Catchments 2016, Eastern Cape York Water Quality Improvement Plan., Cape York Natural Resource Management, Cooktown.
  • 1773. State of Queensland (Department of Agriculture and Fisheries) 2016, Queensland waterways for waterway barrier works - Tidal, Queensland Government, Brisbane.
  • 1774. Kelleway, J. 2006, Ecological impacts of recreational vehicle use on saltmarshes of the Georges River, Sydney, Wetlands (Australia) 22(2): 52.
  • 1775. Trave, C. and Sheaves, M. 2014, Ecotone analysis: assessing the impact of vehicle transit on saltmarsh crab population and ecosystem, SpringerPlus 3(1): 655.
  • 1776. Queensland Government 2023, Queensland Imagery Latest State Program Public Basemap Service, <https://www.data.qld.gov.au/dataset/queensland-imagery-latest-state-program-public-basemap-service>.
  • 1777. Tabrett, S., Ramsay, I., Dias, F.S., Burford, M., Claus, S., et al. 2024, Review of nutrient release from aquaculture activities, prepared for the Office of the Great Barrier Reef, Department of Environment and Science, State of Queensland, Brisbane.
  • 1778. De Costi Seafoods Pty Ltd 2022, EPBC Act Referral: 2022/9156 - Proserpine Prawn Farm - Stage 4, Department of Climate Change Energy Environment and Water.
  • 1779. De Costi Seafoods Pty Ltd 2023, EPBC Act Referral: 2023/09455 - Proserpine Prawn Farm - Stage 4, Department of Climate Change Energy Environment and Water.
  • 1780. De Costi Seafoods Pty Ltd 2023, Initial Advice Statement for the Proserpine Prawn Farm Expansion, De Costi Seafoods Pty Ltd.
  • 1781. The State of Queensland (Department of Premier and Cabinet) 2022, Good news for Queensland oyster industry, media statement 94379, <https://statements.qld.gov.au/statements/94379>.
  • 1782. Department of Transport and Main Roads 2020, Marine Incidents in Queensland 2019, Maritime Safety Queensland, Brisbane.
  • 1783. Department of Transport and Main Roads 2021, Marine Incidents in Queensland 2020, Queensland Government, Brisbane.
  • 1784. Department of Transport and Main Roads 2022, Marine Incidents in Queensland 2021, Queensland Government, Brisbane.
  • 1785. Department of Transport and Main Roads 2023, Marine Incidents in Queensland 2022, Queensland Government, Brisbane.
  • 1786. Maritime Safety Queensland 2024, Current and announced projects, boating facilities, <https://www.msq.qld.gov.au/boating-facilities/current-and-announced-projects>.
  • 1787. Wishaw, D., Heiner, N. and Long, G. 2023, Queensland Recreational Boating Facilities Demand Forecasting Study 2022, Maritime Safety Queensland, Queensland Government, Brisbane.
  • 1788. Department of Tourism Innovation and Sports 2023, Great Barrier Reef Island Marine Infrastructure Package, Queensland Government, Brisbane.
  • 1789. Maritime Safety Queensland 2023, 'Unpublished data: Queensland marine access facilities dredging and disposal adjacent to the GBR, 2019 – 2023'. Unpublished report.
  • 1790. Australian Bureau of Statistics 2021, QuickStats Census All persons, ABS, Canberra.
  • 1791. Department of Environment, Science and Innovation (Parks and Forests) 2023, Ecotourism Plan for Queensland's Protected Areas 2023-2028, Queensland Government, Brisbane.
  • 1792. Minister for Tourism, Innovation and Sport and Minister Assisting the Premier on Olympics and Paralympics Sport and Engagement, The Honourable Stirling Hinchliffe 2022, $3m for better Great Barrier Reef island access, Media Statement 96036, <https://statements.qld.gov.au/statements/96036>.
  • 1793. The Department of State Development, Infrastructure, Local Government and Planning 2023, Woppa (Great Keppel Island) Draft Master Plan 2023, Queensland Government, Brisbane.
  • 1794. Minister for Innovation and Tourism Industry Development and Minister for the Commonwealth Games The Honourable Kate Jones 2019, Work begins on Queensland’s iconic Great Barrier Reef islands, Media Statement 86962, <https://statements.qld.gov.au/statements/86962>.