6.5.1 Trends in land-based runoff

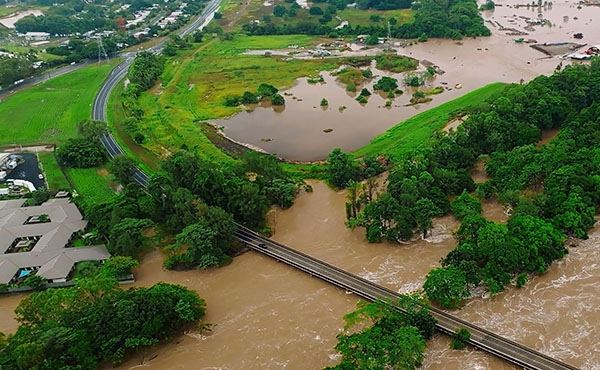
Land-based runoff of pollutants has sharply increased since European settlement along the Queensland coast.1734 40,1748 The development of adjacent catchments is the major contributor to the decline of water quality entering the Reef (Section 6.4). However, changes in land use varies between catchment areas. For example, almost 80 per cent of the grazing land area is contained within the Burdekin and Fitzroy natural resource management (NRM) regions, while much of the area of sugarcane and horticulture crops is in the Wet Tropics, Mackay Whitsunday, and Burnett Mary regions.40 The targets set by the Reef 2050 WQIP consider regional differences in the type of land use and pollutants likely associated with each of the Reef’s 35 coastal catchments, which is crucial information to guide collective effort to improve the water quality flowing to the Reef from land-based sources.693 The catchment profiles provide information about each area including size and rainfall, land use, targets, the priorities for water quality improvement and sources of pollutants management.1826 The highest priority areas for reducing fine sediment, dissolved inorganic nitrogen and pesticide loads are:

  • fine sediment and particulate nutrients: Burdekin, Herbert, Fitzroy and Mary catchments
  • dissolved inorganic nitrogen: Herbert, Haughton, Mulgrave–Russell, Johnstone, Tully and Plane catchments
  • pesticides: Mulgrave–Russell, Johnstone, Herbert, Haughton, Proserpine, O’Connell, Pioneer, Plane and Fitzroy catchments.

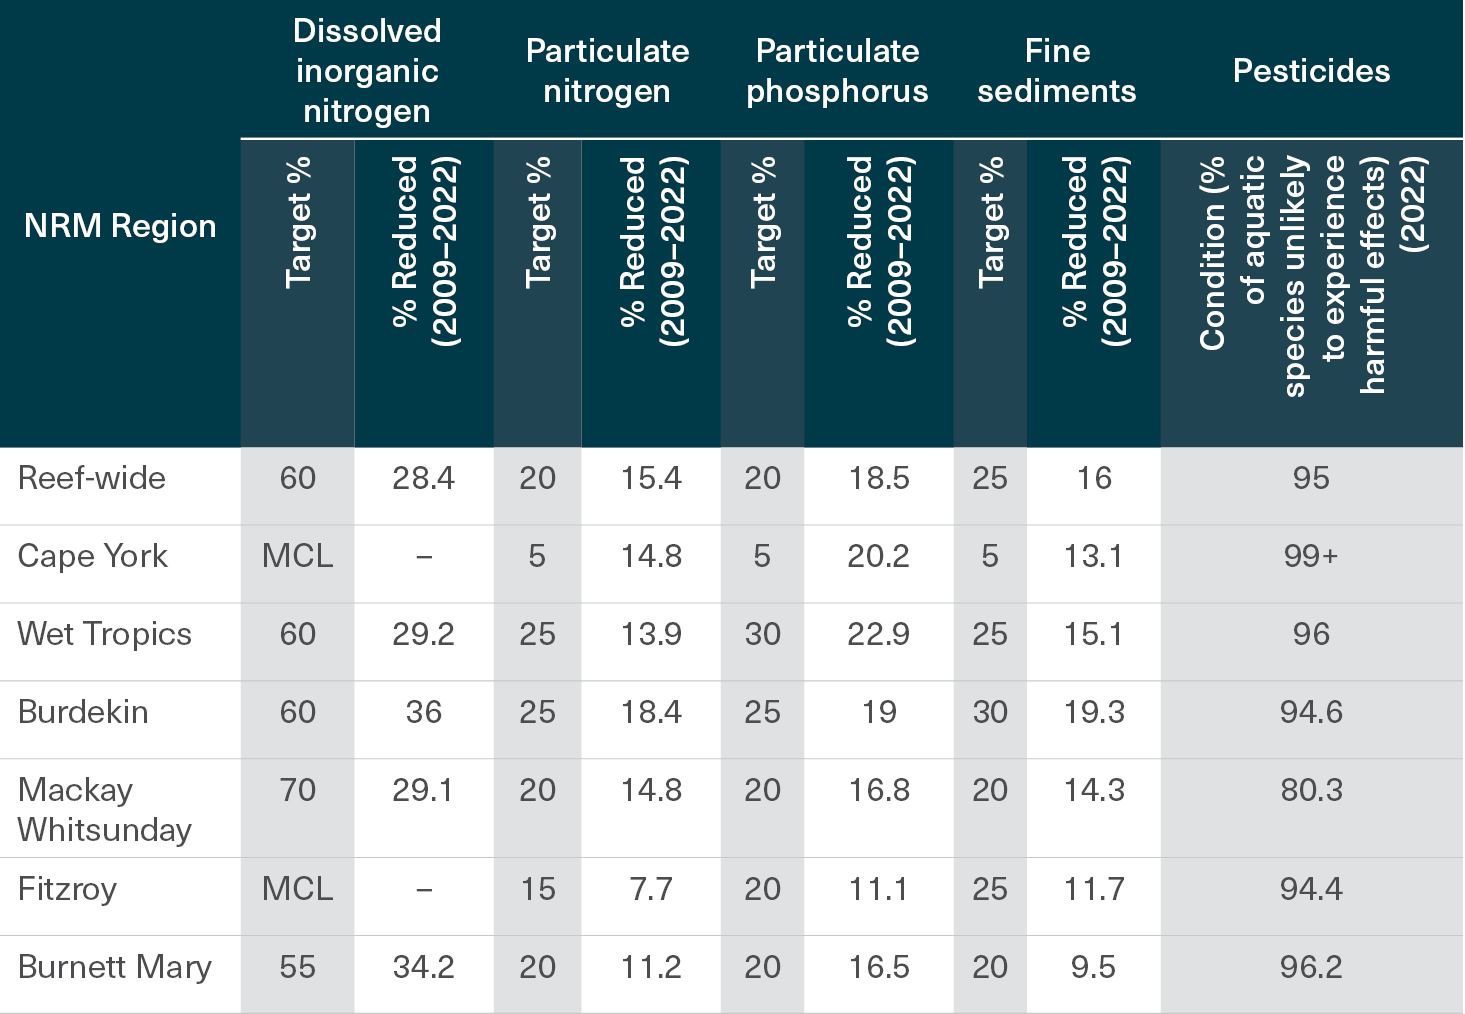
Progress towards targets for fine sediments and dissolved and particulate nutrients (Table 6.2) is reported using modelled end-of-catchment loads, which account for seasonal and climate variability.40,951,1748,1827 This modelling approach enables the estimation of year-to-year reductions in pollutant loads resulting from the adoption of improved land management practices. Additionally, in situ information is collected to validate the models that report on marine condition.951

A concentration-based end-of-catchment assessment is used for the pesticide target that aims to protect at least 99 per cent of aquatic species from all pesticides. The assessment includes 22 pesticides (including herbicides and insecticides) with a focus on reducing concentrations that directly relate to species protection rather than loads.1828

Long-term water quality monitoring data from the end of the catchments are used to validate and improve model estimates over time.1829 Results are reported to June 2022 against the anthropogenic baseline load for 2009.951 In situ inshore marine water quality monitoring, including sediments, nutrients and pesticides, is also conducted to complement the end-of-catchment water quality monitoring.363,1830

Table 6.2
Progress towards 2025 targets for per cent reductions in anthropogenic end-of-catchment loads for the Great Barrier Reef and Natural Resource Management (NRM) regions

MCL: maintain current loads. Source: Queensland Department of Environment, Science and Innovation (2024)951

Row show information for 7 locations including: Reef-wide and 6 individual NRM Regions (Cape York, Wet Tropics, Burdekin, Mackay Whitsunday, Fitzroy and Mary Burnett). Columns show information for the 5 water quality categories: dissolved inorganic nitrogen, particulate nitrogen, particulate phosphorous, fine sediments and pesticides.
tab-ch06-tab6.2--progress-towards-wq-targets

Modeled particulate nitrogen and phosphorus at the end of the catchment has slightly reduced

Nutrients

Land-based runoff is one of the largest sources of excess nutrients entering the Reef.1816 Since European settlement, loads of dissolved inorganic nitrogen — the nutrients of most concern in marine ecosystems — exported from the Catchment have approximately doubled (and rates have more than doubled from 11 of the 35 catchments).1748,1831  Other sources of excess nutrients include wind resuspension and remineralisation of particulate nutrients.1832 Nutrient cycling by phytoplankton 1833 also occurs (Section 3.3.1). The nitrogen-fixing cyanobacteria Trichodesmium is a source of nitrogen to the Region 1834 that may be responding to increased availability of phosphorus 356,1835 (Section 3.3.1). Understanding of the relative contribution and potential impacts of Trichodesmium remains limited.710

Loss of nutrients to the environment through runoff and leaching is of particular concern from cropping systems in which large quantities of fertilisers are applied in high-rainfall areas, and where transport to waterways following intense rainfall events is more likely.1748 Additionally, urban and industrial development contribute 7 per cent to Reef-wide loads of dissolved inorganic nitrogen, particularly around the urban areas of Townsville and Cairns.1748

Dissolved inorganic nitrogen

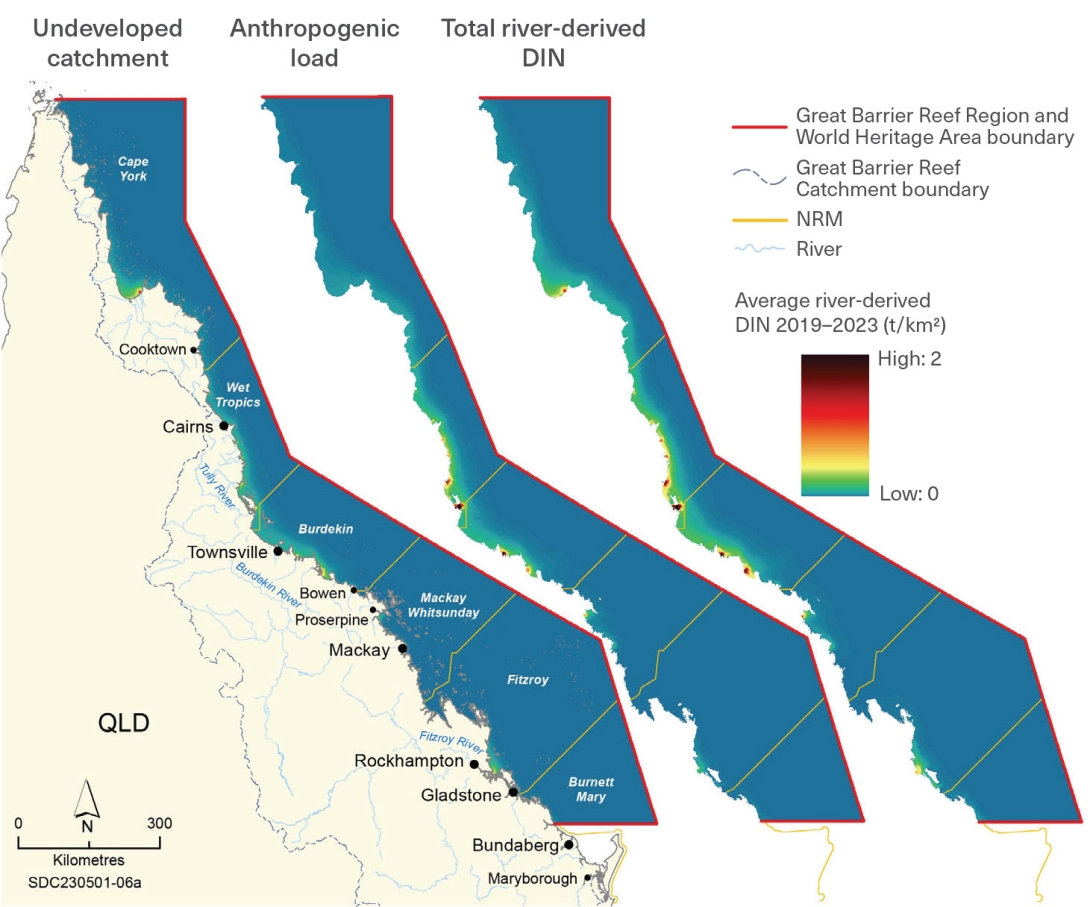
The Wet Tropics region is the source of almost half (47 per cent) of the total modelled dissolved inorganic nitrogen exported into the Reef lagoon, and almost half of this amount is from sugarcane plantations.1748 Sugarcane-growing areas in the Mackay Whitsunday, lower Burdekin, and Burnett Mary regions are considered hotspots for excess generation and export of dissolved inorganic nitrogen to the Region’s waterways (Figure 6.13).1748,1836,1837

Figure 6.13
Average modelled dispersal of river-derived dissolved inorganic nitrogen (DIN) loads for water years 2019 to 2023 (1 October to 30 September)

The maps represent an average from 2019 to 2023 of: (left) DIN loads from a modelled undeveloped catchment; (middle) the anthropogenic component of river-derived DIN; and (right) total river-derived DIN load from the Catchment. Source: Gruber et al. (2024)579

This figure comprises 3 maps with sea area shaded along a colour gradient to show spatial variation in average river-derived DIN across the Region for 2019 to 2023.

Widespread flooding in the Burnett Mary catchment in early 2022 resulted in large pulses of dissolved nutrients entering nearshore waters south of the Region 579  and contributed to further declines in abundance and resilience of seagrass meadows at Rodds Bay.145 Nitrate is also elevated in groundwater in many areas under intensive agriculture.1838 The Cape York and Fitzroy regions contribute minimal anthropogenic dissolved inorganic nitrogen loads, and no end-of-catchment targets have been set for dissolved inorganic nitrogen.1839 Relatively small areas are under banana cultivation in the Cape York region, and under sugarcane cultivation in the Fitzroy region.1748 The aim in these regions is to maintain current loads to avoid increases in nutrients entering the Reef lagoon. 

Modelled end-of-catchment loads of dissolved inorganic nitrogen from anthropogenic sources decreased by 28.4 per cent across the Region between 2009 and 2022 (Table 6.2).951 Improvements in the Wet Tropics region (cumulative reduction of 29.2 per cent), including a 6.4 per cent improvement in the Johnstone catchment for 2020, were mainly attributed to the adoption of improved management practices in sugarcane cultivation and use of mill mud, a processing byproduct.951 Large improvements for the Haughton catchment (slightly over 50 per cent reduction from the 2009 baseline) have contributed to a 36 per cent reduction in dissolved inorganic nitrogen loads for the Burdekin region to 2022.951

In the Mackay Whitsunday region, a 29.1 per cent reduction to 2022 included a decrease of 2.3 per cent in modelled end-of-catchment loads since 2016.951 A reduction of 34.2 per cent for the Burnett Mary region has been attributed to improved mill mud management in the Mary catchment and improved sugarcane nutrient management where nitrogen application rates were reduced in the Burnett and Burrum catchments.951

In the marine environment, dissolved inorganic nitrogen concentrations in inshore waters of the Wet Tropics region have been above local guideline values since monitoring started in 2005. From 2017 to 2022, elevated levels of nitrogen remained prevalent across the Wet Tropics region.363 In the Mackay Whitsunday region, dissolved inorganic nitrogen concentrations in inshore marine waters have been stable over the past 5 years, but remained well above (up to 7 times) guideline values despite 3 years of below-average discharge between 2020 and 2022 (Section 3.2.3).363

Particulate nitrogen and phosphorus

Most of the terrestrial phosphorus and up to a third of the nitrogen discharged into the Reef is carried in particulate form, often bound to fine sediment particles.1770,1819 Particulate nutrients must be remineralised before they become bioavailable,1840 but they are important sources contributing to excessive nutrients, particularly dissolved nitrogen, in some nearshore Reef waters 595,693 (Section 6.5.2). Hillslope losses are considered the major source of particulate nutrients across the Region.40,1770 The proportion of particulate nitrogen and phosphorus in runoff is similar across the Catchment, with the Burdekin and Fitzroy regions the largest contributors of total loads reaching the Reef.40 It is estimated that the Fitzroy region contributes 22 per cent of the particulate nitrogen and 29 per cent of particulate phosphorus exported to the Reef, mainly associated with high loads of sediments in this region.40

Across the Region, end-of-catchment particulate nitrogen and phosphorus showed a modelled reduction of 15.4 and 18.5 per cent, respectively (Table 6.2).951 Reductions have been detected in all NRM regions but vary across the Region. In the Wet Tropics region, recent gains have been largely due to improved soil management practices in sugarcane areas, especially in the Johnstone catchment.951 Reduced grazing pressure in the Burdekin catchment, improved soil management projects in the Haughton catchment, improved grazing practices in the Mackay Whitsunday region, and riparian fencing projects in the Burnett Mary region, all contributed recent reductions in loads of particulate nutrients.951 Improved hillslope management in grazing areas and improved soil erosion management in cropping areas have contributed to modest reductions in particulate nutrient loads from the Fitzroy region.951 Cape York, which has lower intensity livestock grazing and limited intensive cropping compared to other regions, is meeting its end-of-catchment reduction targets for particulate nutrients.

In the Wet Tropics region, concentrations of particulate nutrients in marine waters have remained stable and below local marine guideline values in the Barron, Daintree and Johnstone catchments.363 However, between 2017 and 2022 increased particulate nitrogen was detected in the Herbert and Tully catchments at concentrations above local guideline values.363 In inshore marine waters adjacent to these catchments, both particulate nitrogen and phosphorus decreased over the past 3 years, and concentrations are meeting guideline values.363 In inshore marine areas in the Burdekin region, particulate phosphorus has been stable and below guideline values since monitoring began in 2005, 363 while particulate nitrogen has declined over the past 5 years but remains above guideline values.363

In the Fitzroy region, inshore marine concentrations of particulate and dissolved nutrients have been stable for the past 2 years, but they have not been meeting guideline values.363 While improvements have been made in modelled end-of-catchment nutrient loads in Cape York,951 dissolved and particulate nitrogen concentrations have often exceeded guideline values in the inshore marine environment over the past 5 monitoring seasons,363 possibly driven by wind resuspension as opposed to land-based runoff.579 Particulate phosphorus in this region met guideline values in 2021–22 after consecutive years of improvement.

Sediments

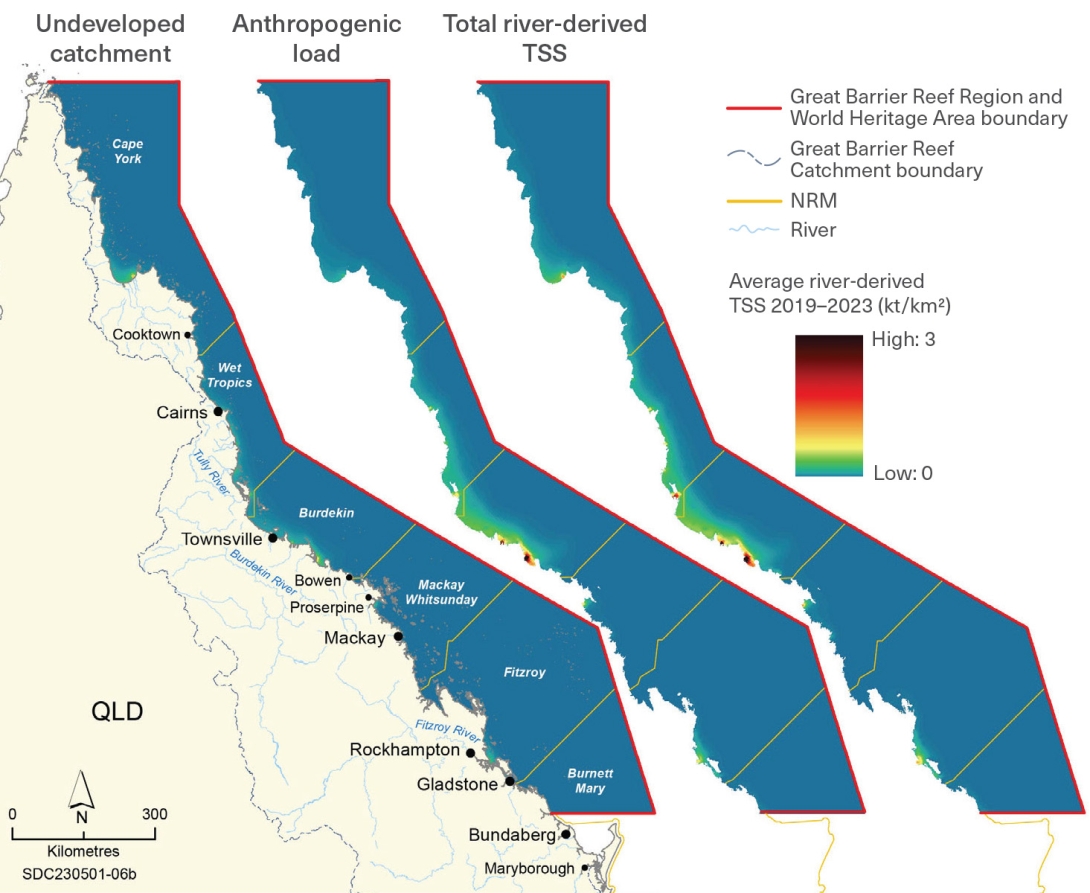
The main source of sediments to the Region is sub-surface erosion (gully, streambank, and deep rill erosion from hillslopes).40,1770,1819,1836 A large proportion of river-derived sediment loads is anthropogenic (Figure 6.14).574 Since European settlement, fine sediments entering the Reef lagoon are estimated to have increased between 1.4 to 5 times and, in some catchments, up to eight-fold.574 Fine sediment (less than 20 micrometres) is the fraction most likely to reach the Reef lagoon and is the dominant proportion in monitored fine sediment loads across the Region.586,1770 Although most land-sourced sediments are deposited close to river mouths and remain within inshore areas, some fine sediments can be carried long distances away from river mouths, as well as being resuspended by wind and tidal currents in shallower waters 586 (Section 3.2.4), with consequent chronic impacts on exposed species and habitats 39 (Sections 3.2.4 and 6.5.2).

Large variability in sediment delivery is linked to rainfall and flooding

Export of fine sediments to the Reef is dominated by the Region’s 2 largest rivers, the Burdekin and Fitzroy, with the Burdekin River the largest individual contributor.1841,1816 A study reconstructing land use changes on river catchments from extended coral growth records, documented a 3-fold increase in suspended sediment loads delivered by the Burdekin River flood plume to the Region relative to pre-European baseline levels.1842 The Burdekin region has an estimated average annual fine sediment load of 3.7 million tonnes, contributing nearly 45 per cent of the total loads exported (total loads of ~8.5 million tonnes) from the Catchment,40 followed by the Fitzroy (18 per cent), and the Wet Tropics and Burnett Mary regions (each 15 per cent).1843,40 Nevertheless, large variability in sediment delivery is linked to rainfall and flooding, particularly in the large dry tropical catchments and, as a result, relative catchment contributions — and the marine regions affected — can vary greatly from year to year.1819,586

Aerial image of a large area of an gully that is eroding along its banks. The gully contains mostly dried sediment with very limited vegetation, but is surrounded by grassy landscape with sparse trees and a dirt road.
Catchment gully erosion. © Matt Curnock 2019
Figure 6.14
Average modelled dispersal of river-derived total suspended sediment (TSS) loads for water years 2019 to 2023 (1 October to 30 September)

Maps represent an average from 2019 to 2023 of: (left) TSS loads from a modelled undeveloped catchment; (middle) the anthropogenic component of river-derived TSS; and (right) total river-derived TSS load from the Catchment. Source: Gruber et al. (2024)579

This figure comprises 3 maps with sea area shaded along a colour gradient to show spatial variation in average river-derived TSS across the Region for 2019 to 2023.

Across the Region, dry tropical grazing lands are the dominant source of fine sediment loads, sugarcane contributes significantly to exports in the Wet Tropics and Mackay Whitsunday regions, and dryland cropping contributes the most in the Fitzroy region.1819 Locally, specific catchment characteristics are often important. For example, intensively cropped basalt areas in the Fitzroy basin make a disproportionate contribution to fine sediment loads in that region.1844 In the Wet Tropics and Mackay Whitsunday regions, fine sediment export is proportionately lower than for nutrients, due mainly to more consistent rainfall and year-round surface vegetation cover, but sugarcane and banana cropping areas have high sediment yields per unit area.1770 Some parts of the Wet Tropics have high natural sediment loads.1770

A Region-wide cumulative reduction of 16 per cent has been observed against the 25 per cent end-of-catchment load target for fine sediments (Table 6.2), although only a small reduction of 0.8 per cent was modelled from 2020 to 2022.951 The largest modelled reduction in sediment loads during 2020–2022 was of 1.4 per cent (approximately 17 kilotonnes) in the Fitzroy region, with most of the load reduction attributed to grazing management change throughout the broader Fitzroy catchment and streambank restoration in the Lower Fitzroy sub-catchment. Cape York had a 5 per cent target and has been successfully maintaining the current loads, seeing continued improvement with an annual modelled reduction of 0.9 per cent from 2020 to 2022 (approximately 1.5 kilotonnes). The Reef 2050 WQIP proposed a 30 per cent reduction (8.9 kilotonnes) target for the Burdekin River, the largest individual contributor to sediment loads across the Region.1825 Queensland and Commonwealth governments have invested over $50 million for landscape remediation and catchment repair within Burdekin catchments since 2016 towards this aim. Progress towards this target is lagging, with a cumulative 19.3 per cent reduction modelled against the 2009 baseline.951

In the Wet Tropics, results were mixed in terms of modelled reduction of end-of-catchment sediment. Overall, a cumulative reduction of 15.1 per cent to 2022, below the target of 25 per cent, has been modelled. Catchments such as the Barron and Daintree have minimal anthropogenic load and are expected to maintain their current loads. The Mulgrave–Russell have met the target over the past four reporting periods, while the Murray catchment met the reduction target of 20 per cent in 2022.951 However, progress towards achieving the 2025 targets has been slower in the other southern catchments of Johnstone, Herbert and Tully rivers. For example, in the Herbert catchment a cumulative reduction of 10.1 per cent (compared with the 30 per cent target) was observed from 2009 to 2022. In the Mackay Whitsunday region, the Proserpine River and Plane Creek catchments are successfully maintaining current loads, but the O’Connell and Pioneer catchments have progressed more slowly, with a modelled cumulative reduction of sediments of only 6.1 per cent for the Pioneer catchment to 2022. In the Fitzroy region, a cumulative reduction of 11.7 per cent to 2022, and an annual reduction of only 1.4 per cent (approximately 17 kilotonnes) from July 2020 to June 2022 951 was achieved. Among NRM regions, the smallest reduction in anthropogenic fine sediment load was detected in the Burnett Mary region, with a reduction of 0.3 per cent between 2020 and 2022, and a cumulative reduction of 9.5 per cent to date.951

In the inshore marine environment, fine sediment concentration has been increasing in some regions and decreasing in others.363 In the Burdekin region, where fine sediments are an ongoing issue, trend analysis showed that from 2017 to 2022, mean concentration of sediments improved, but only marginally, and fine sediments are currently exceeding guideline values at most sites. In the Fitzroy region, nearshore concentrations of sediments have increased over the past 2 years. In the Wet Tropics, inshore sediment concentrations have been improving since 2017, and they are meeting guidelines at most sites in all 3 subregions (Barron–Daintree, Mulgrave–Russell, and Herbert–Tully). The concentrations of sediments in the inshore marine region of the Mackay Whitsunday region showed improvement from 2017 to 2022 and they are currently meeting guideline values, likely driven by below-average rainfall over the past 3 years. Sediment concentrations often met guideline values in Cape York, except after heavy rainfall events. From 2019 to 2022, enclosed coastal sites influenced by the Normanby River frequently exceeded guideline values.363

Pesticides

Pesticides, including insecticides, herbicides, fungicides, miticides and rodenticides, are widely used in Australian agriculture and are often detected in Catchment waterways and inshore marine monitoring sites in the Region.1830,1845,1846,1847,1848  Pesticides represent a group of anthropogenic chemicals that were not present prior to European settlement.574  The concentrations of many different pesticides, and therefore the combined risk associated with all those pesticides, are highest in areas of intensive agriculture, including sugarcane, and horticultural crops, such as bananas.1734,1849,1850

Pesticides are often detected in waterways and inshore monitoring sites

The downstream concentrations of individual pesticides, and the risk associated with mixtures of pesticides, reflect the type and intensity of upstream agricultural land uses. In current Reef water quality reporting, that risk is expressed as a Pesticide Risk Metric,1850 both in the freshwater catchments 951 and in the inshore marine waters.1830,1851 

Different agricultural land uses are characterised by the use of different pesticides. In terms of major land uses, the Burnett Mary, Fitzroy, and Burdekin regions are all dominated by grazing (more than 70 per cent), which does not require large amounts of pesticide apart from tebuthiuron.1852

Sugarcane cropping is one the main sources of pesticide risk to aquatic ecosystems in the waterways of the Wet Tropics, Burdekin, and Mackay Whitsunday NRM regions. Several pesticides generally contribute to that risk, including photosystem II-inhibiting (PSII) herbicides, such as diuron, atrazine and hexazinone, the insecticide imidacloprid and other herbicides, such as metolachlor and imazapic.1829,1853 PSII herbicides disrupt a key step in plant photosynthesis and can negatively affect the health of exposed seagrasses and other marine plants and algae 1854 (Section 6.5.2).

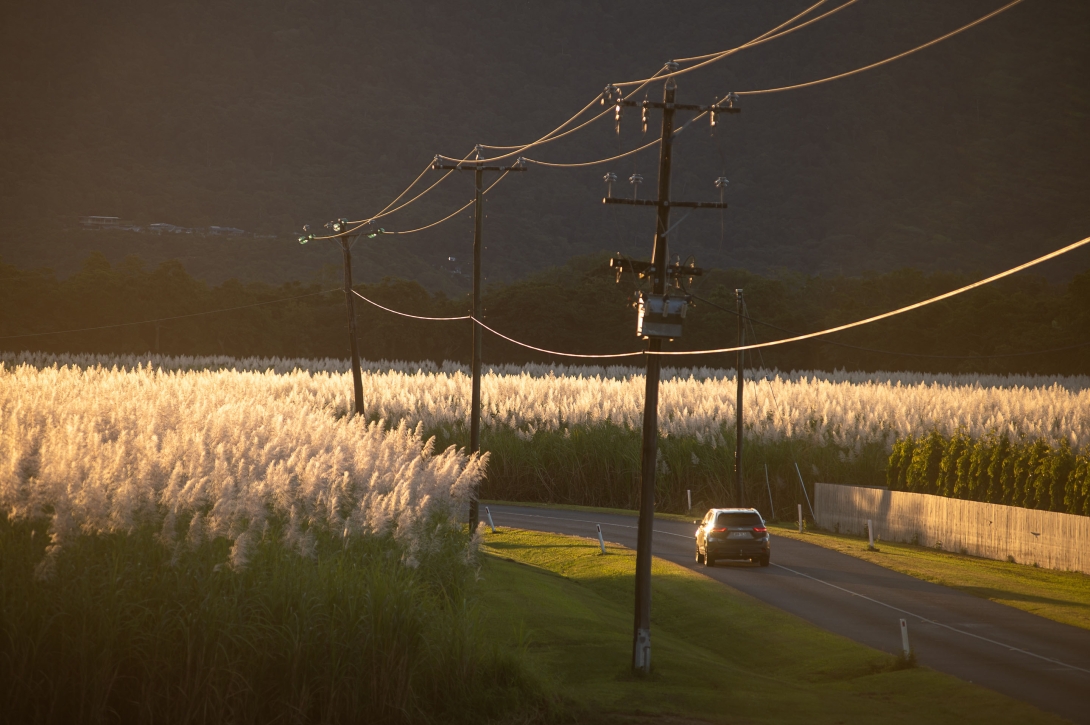
Fields of flowering sugar cane lit up in late afternoon sun, with car driving along a road between the fields. There are powerlines running alongside the road also lit up by the sun.
Sugar cane cultivation in the Wet Tropics contributes to fine sediment export. © Dieter Tracey 2024

The PSII herbicide diuron and the neonicotinoid insecticide imidacloprid represent the largest contributors to risk downstream of intensive sugarcane agriculture in the coastal catchments of the Wet Tropics and Mackay Whitsunday regions.1847,1853 Diuron is typically associated with the intensive sugarcane farming in the coastal area of the Tully River and the Herbert River in the Wet Tropics region, and the Pioneer River and Sandy Creek catchments in the Mackay Whitsunday region. Since monitoring commenced in 2010, diuron concentrations have typically been higher in marine waters adjacent to these catchments and regions than in other inshore areas.1855 Atrazine, which is also registered for use in sugarcane crops, has historically been used extensively in the Barratta Creek and Lower Burdekin sub-catchments in the Burdekin region.1855,1856

The spatial pattern of pesticide concentrations in the marine environment reflects the dominant land use in the adjacent catchment, and the highest concentrations are found closest to the source.589 In the inshore marine environment, the highest concentrations of pesticide are found at the Mackay Whitsunday region, in particular Flat Top Island, Repulse Bay and Sarina Inlet,578 although low pesticide risk was reported for most inshore sites in the 2022–23 wet season.1851

Across the Catchment, the pesticide risk condition in 2022 indicated that 95 per cent of aquatic species at the end of catchment were unlikely to experience harmful effects of pesticides (Table 6.2), a reduction of 2.4 per cent from previous reporting period. Within NRM regions, some catchments had a much lower level of protection and will require considerably larger improvements to meet the target. The Mackay Whitsunday region remains the region with the highest pesticide risk, and few signs of improvements were shown from 2016 to 2022.951 In this region, monitoring results indicate that, in 2022, 80.3 per cent of aquatic species were unlikely to experience harmful effects from pesticides. In the Plane Creek catchment, this protection was 73.9 per cent, with a decline in protection of species from 2020 to 2022 from 76.5 per cent.951

Within the Wet Tropics region, the Daintree and Barron catchments were associated with a lower pesticide risk, relative to the region as a whole, and the Mulgrave–Russell, Johnstone and Herbert catchments were associated with a higher risk. The Tully catchment improved from a moderate to good rating from 2016 to 2020, associated with a notable decrease in the contribution of insecticides, particularly imidacloprid.1741 However, the risk for the Tully catchment deteriorated to moderate again from 2020 to 2022.951 

In the Burdekin region, pesticide risk levels decreased as a whole; however, the Haughton catchment scored as poor, and from 2016 to 2022, protection of aquatic organisms decreased from 86 to 80 per cent.951 In the Fitzroy region, coastal intensive cropping is limited and risk rankings are generally low. However, widespread use of pesticides occurs in the Fitzroy River catchment — in the beef grazing areas where the herbicide tebuthiuron is used for ‘woody weed’ control.1847 Additionally, the herbicide metolachlor represents an important contributor to pesticide risk at the end of the catchment and reflects the irrigated cropping agriculture further up the catchment.1829 At the end of catchment, 94.4 per cent of species are protected from pesticide risk, representing a small decline from 2019.1741

Cape York remains a low-risk location due to minimal intensive cropping practices that require pesticide use. In the Burnett Mary region, particularly in the lower reaches of the Kolan catchment, which is dominated by sugarcane and horticultural crops, imidacloprid and the herbicides metsulfuron-methyl, diuron, atrazine and metolachlor represent important contributors to pesticide risk in several of the smaller catchments draining to the Reef lagoon.1829

Concentrations of pesticides in the Region’s marine waters remain generally below guideline values. Pesticides in marine samples are often compared with Australian freshwater species protection guidelines since no guidelines are currently available for marine environments. Since 2019, no clear reduction in inshore marine pesticide concentrations has been linked to improved land management practices.1828,1857 During the monitoring period 2019 to 2023, the most consistently detected pesticides at inshore marine sites (for the majority of assessed locations) were diuron, atrazine and hexazinone, along with abundant PSII herbicides.578,1830 These were also the highest concentration pesticides, reflecting land use in sugarcane, horticulture and grain cropping industries. Monitoring results from the 2022–23 wet season showed that atrazine and diuron were still detected at Low Isle and Sarina Inlet. After heavy rainfall in January 2023 in the Mackay Whitsunday region, diuron at a concentration of 312 nanograms per litre was reported at Sarina Inlet.1830

A recent temporal trend analysis of up to 14 years monitoring data, from 2005 to 2018, on 5 commonly found pesticides (ametryn, atrazine, diuron, tebuthiuron and hexazinone), at 11 inshore marine monitoring sites revealed a significant increasing trend for all 5 pesticides at several monitoring sites.1845 Monitoring sites at Low Isles, Sarina Inlet and North Keppel Island presented statistically robust increasing trends in atrazine, diuron and hexazinone. Detection of pesticides in the North Keppel Island area remained generally low until monitoring in that region ceased in 2019. 

Marine debris

The accumulation of anthropogenic debris, especially plastics, in marine and coastal areas has environmental, economic, aesthetic and human health impacts.1858,1572,1859 Marine debris is a cause for concern due to its abundance, durability and persistence in the marine environment.561,1860,1861  It is among the major perceived threats to biodiversity worldwide.1862 Marine debris, primarily hard plastic, is prevalent in Australian waters,1863,1864,1865,1866 with current and projected coastal development likely to increase its presence in the Region.1867 Smaller plastic particles, including microplastics (less than 5 millimetres) are consistently detected in surface waters of the Reef1868,1869,1870 and can represent up to 50 per cent of marine debris in some areas.1869 Nevertheless, surveys conducted across the Region from 2019 to 2023 revealed that microplastic loads are generally low, especially in comparison to the more densely populated regions of the country.1871 In addition to plastics, other items, such as glass, rubber, and foam comprised a substantial proportion of total debris found in Australian waters, both in coastal and offshore areas.1872

This photo shows a plastic bottle floating on the surface of the water above a sandy seafloor. The split photo includes perspectives above and below water. Below the water, goose barnacles and brown algae are attached to the bottle.
Goose barnacles growing on a plastic water bottle that has been washed into the ocean. © Johnny Gaskell 2024

Studies show that marine debris is often derived from a combination of marine and land-based sources.1867 However, the contributions of likely sources, such as large commercial, military and recreational vessels, commercial fishing and tourism boats, aquaculture installations, sewage and storm water, industrial facilities, coastal tourism involving recreational visitors and beachgoers, and riverine transport of waste from landfills and other inland sources, is relatively unknown.1867 Remnant plastic pieces (hard and solid) (227,395 items) and plastic lids and tops, pump spray and flow restrictors (100,430 items) remained the most common categories of debris collected from 2019 to 2022.1866 

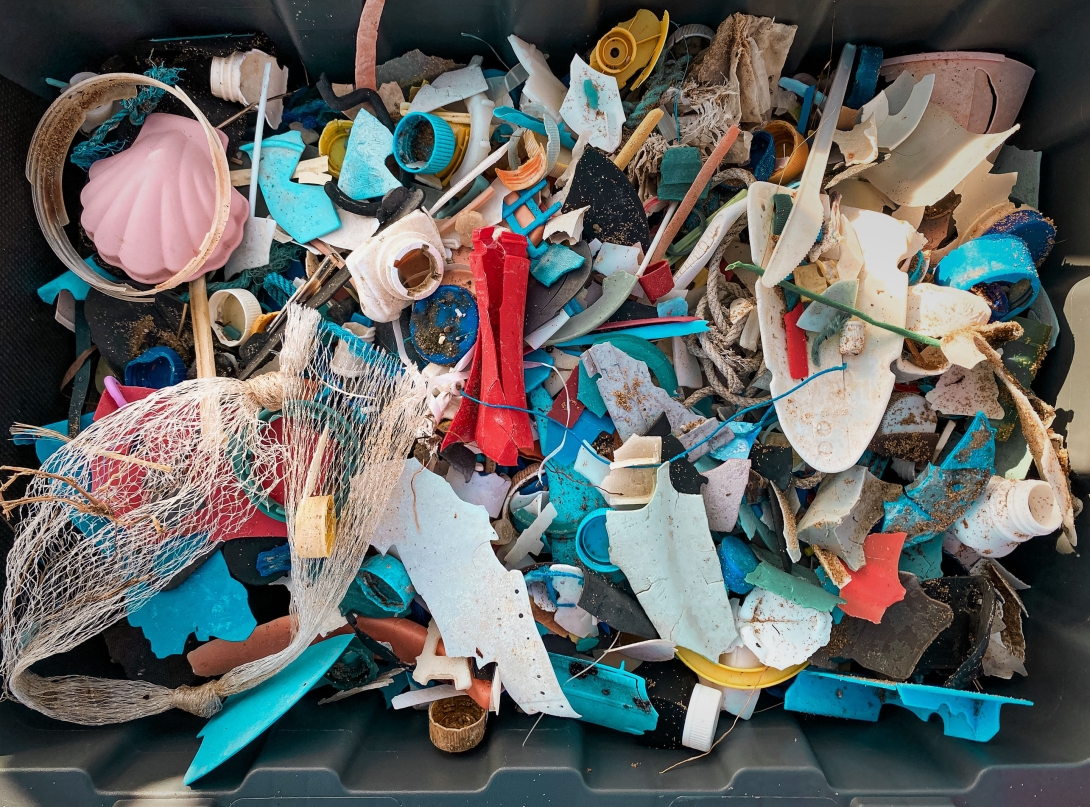
A photo of a collection of brightly coloured plastic pieces that have been collected as part of a marine debris cleanup, including nets, string, bottle lids, plastic toy and many broken fragments.
Alva Beach marine debris cleanup with Tangaroa Blue © Ashlee DeVore 2023

The quantity and relative contributions of some types of marine debris collected along the Reef’s coast and islands vary from north to south.1866 In 2022, a total of 27.3 tonnes of marine debris was removed in 296 beach clean-ups. Between 2019 and 2022, the heaviest mass (10,231 kilograms) and greatest density (0.12 items per metre) of debris was collected in the Cape York region. For the past 4 years, more than 85 per cent of the debris in every zone of the Cape York region is predicted to have come from offshore sources. Of all NRM regions, debris was least dense in Burnett Mary with just 0.004 items per square metre.1866 Awareness of marine debris as a threat is increasing,1873 and efforts to improve trends across the Region are underway.1866,1874

Other pollutants

Other pollutants, such as metals and metalloids, pharmaceutical and personal care products, persistent organic pollutants and fire retardants are found in the Region.1867,1875 The sources of these pollutants are diverse and include point sources, such as urban and industrial wastewater treatment plans, and diffuse sources, such as land-based runoff.1867 However, monitoring and long-term studies are still lacking for these groups of pollutants, so no temporal trend can be determined, and information is generally limited.

Metals and metalloids occur naturally in rock and soils and can enter the aquatic environment through weathering, erosion and atmospheric deposition.1867 Human activities can increase the presence of metals in the environment. These pollutants are derived from a range of diffuse and point sources along the Catchment, including agriculture, mining and industrial runoff; urban centres; waste treatment and disposal; ports and harbours; atmospheric deposition; coastal and marine tourism; military areas; and shipping.705,1867,1875 Metals and metalloids have been detected in water and sediment in the Reef, including the ports of Abbot Point, Cairns, Gladstone, Hay Point and Townsville. Based on available monitoring information, dissolved metal and metalloid concentrations in surface waters were typically low.1867 Metals have also been found abundantly in sediments and algal turfs around Lizard Island and Orpheus Island. Metal composition and concentrations at Orpheus Island suggest influence from land-based runoff.1876

Pharmaceuticals comprise a broad range of human and veterinary medical products including antibiotics, hormones and endocrine-disrupting contaminants.1875 Personal care products comprise a large array of consumer products generally used on the human body, such as cosmetics, toiletries or fragrances that contain active ingredients to prevent diseases or alter odour, appearance, touch or taste.1867 Both groups of compounds have been found in Reef waters in low concentrations.1877,1878 Comparison between coastal and offshore locations demonstrated that the presence and concentrations of pharmaceuticals and personal care products are linked to proximity to sources of wastewater discharge into coastal waters,1878 as well as high-tourism areas.1875

Persistent organic products (POPs) include polycyclic aromatic hydrocarbons (PAHs), petroleum products (associated with land use), chlorinated polychlorinated-p-dioxins (PCDDs), polychlorinated dibenzofurans (PCDFs), polychlorinated biphenyls (PCBs) and hexachlorobenzene (HCB). The primary potential sources of POPs were associated with flood and runoff from urbanisation, industry, mining activities, as well as oil spills in the Marine Park.1867,1879 Regular monitoring of POPs does not occur in the Region. However, most petroleum hydrocarbon contamination occurs around port areas, and POPs are likely to accumulate in sediments close to loading facilities.1867 PAHs and PCBs are included in sediment monitoring at ports requesting to dispose of spoil material within the Marine Park.

References
  • 39. Collier, C., Brown, A., Fabricius, K., Lewis, S., Diaz-Pulido, G. et al. 2024, 2022 Scientific Consensus Statement: Summary | Evidence Statement for Question 3.2: What are the measured impacts of increased sediment and particulate nutrient loads on GBR ecosystems, what are the mechanism(s) for those impacts and where is there evidence of this occurring in the GBR? in 2022 Scientific Consensus Statement on land-based impacts on Great Barrier Reef water quality and ecosystem condition, eds J. Waterhouse, M. Pineda and K. Sambrook, Commonwealth of Australia and Queensland Government.
  • 40. McCloskey, G.L., Baheerathan, R., Dougall, C., Ellis, R., Bennett, F.R., et al. 2021, Modelled estimates of fine sediment and particulate nutrients delivered from the Great Barrier Reef catchments, Marine Pollution Bulletin 165: 112163.
  • 145. McKenzie, L.J., Collier, C.J., Langlois, L.A. and Yoshida, R.L. 2023, Marine Monitoring Program: annual report for inshore seagrass monitoring 2021–22. Report for the Great Barrier Reef Marine Park Authority, Great Barrier Reef Marine Park Authority, Townsville.
  • 356. Richardson, A., Eriksen, R., Moltmann, T., Hodgson-Johnston, I. and Wallis, J.R. 2020, State and Trends of Australia’s Ocean Report, Integrated Marine Observing System, Hobart.
  • 363. Moran, D., Robson, B., Gruber, R., Waterhouse, J., Logan, M., et al. 2023, Marine Monitoring Program Annual Report 2021-22 Water Quality, Great Barrier Reef Marine Park Authority, Townsville.
  • 561. Critchell, K., Grech, A., Schlaefer, J., Andutta, F.P., Lambrechts, J., et al. 2015, Modelling the fate of marine debris along a complex shoreline: Lessons from the Great Barrier Reef, Estuarine, Coastal and Shelf Science 167: 414-426.
  • 574. Lewis, S., Bainbridge, Z. and Smithers, S. 2024, 2022 Scientific Consensus Statement: Summary | Evidence Statement for Question 2.3: What evidence is there for changes in land-based runoff from pre-development estimates in the GBR? in 2022 Scientific Consensus Statement on land-based impacts on Great Barrier Reef water quality and ecosystem condition, eds J. Waterhouse, M. Pineda and K. Sambrook, Commonwealth of Australia and Queensland Government.
  • 578. Moran, D., Robson, B., Gruber, R., Waterhouse, J., Logan, M., et al. 2022, Marine Monitoring Program: Annual Report for Inshore Water Quality Monitoring 2020-21. Report for the Great Barrier Reef Marine Park Authority, Great Barrier Reef Marine Park Authority, Townsville.
  • 579. Gruber, R., Moran, D., Robson, B., Waterhouse, J., Logan, M., et al. 2024, Marine Monitoring Program: Annual report for inshore water quality monitoring 2022–23. Report for the Great Barrier Reef Marine Park Authority, Great Barrier Reef Marine Park Authority, Townsville.
  • 586. Lewis, S., Bainbridge, Z. and Smithers, S. 2024, 2022 Scientific Consensus Statement: Summary | Evidence Statement for Question 3.1: What are the spatial and temporal distributions of terrigenous sediments and associated indicators within the GBR? in 2022 Scientific Consensus Statement on land-based impacts on Great Barrier Reef water quality and ecosystem condition, eds J. Waterhouse, M. Pineda and K. Sambrook, Commonwealth of Australia and Queensland Government.
  • 589. Brodie, J.E., Lewis, S.E., Collier, C.J., Wooldridge, S., Bainbridge, Z.T., et al. 2017, Setting ecologically relevant targets for river pollutant loads to meet marine water quality requirements for the Great Barrier Reef, Australia: a preliminary methodology and analysis, Ocean &Coastal Management 143: 136-147.
  • 595. Garzon-Garcia, A., Burton, J.M., Lewis, S., Bainbridge, Z., De Hayr, R., et al. 2021, The bioavailability of nitrogen associated with sediment in riverine plumes of the Great Barrier Reef, Marine Pollution Bulletin 173: 112910.
  • 693. Waterhouse, J., Brodie, J., Tracey, D., Smith, R., Vandergragt, M., et al. 2017, Scientific Consensus Statement 2017: A synthesis of the science of land-based water quality impacts on the Great Barrier Reef, Chapter 3: The risk from anthropogenic pollutants to Great Barrier Reef coastal and marine ecosystems, State of Queensland, Brisbane.
  • 705. Strzelec, M., Proemse, B.C., Gault-Ringold, M., Boyd, P.W., Perron, M.M., et al. 2020, Atmospheric trace metal deposition near the Great Barrier Reef, Australia, Atmosphere 11(4): 390.
  • 710. Robson, B., Brown, A. and Uthicke, S. 2024, 2022 Scientific Consensus Statement: Summary | Evidence Statement for Question 4.1: What is the spatial and temporal distribution of nutrients and associated indicators within the GBR? in 2022 Scientific Consensus Statement on land-based impacts on Great Barrier Reef water quality and ecosystem condition, eds J. Waterhouse, M. Pineda and K. Sambrook, Commonwealth of Australia and Queensland Government.
  • 951. The State of Queensland (Department of Environment and Science) and Australian Government 2024, Reef Water Quality Report Card 2021- 2022, DES, Brisbane.
  • 1734. Lewis, S.E., Bartley, R., Wilkinson, S.N., Bainbridge, Z.T., Henderson, A.E., et al. 2021, Land use change in the river basins of the Great Barrier Reef, 1860 to 2019: A foundation for understanding environmental history across the catchment to reef continuum, Marine Pollution Bulletin 166: 112193.
  • 1741. The State of Queensland (Department of Environment and Science) 2022, Reef Water Quality Report Card 2020, <https://reportcard.reefplan.qld.gov.au/>.
  • 1748. McCloskey, G.L., Baheerathan, R., Dougall, C., Ellis, R., Bennett, F.R., et al. 2021, Modelled estimates of dissolved inorganic nitrogen exported to the Great Barrier Reef lagoon, Marine Pollution Bulletin 171: 112655.
  • 1770. Bartley, R., Waters, D., Turner, R., Kroon, F., Wilkinson, S., et al. 2017, Scientific Consensus Statement 2017: A Synthesis of the Science of Land-based Water Quality Impacts on the Great Barrier Reef, Chapter 2: Sources of sediment, nutrients, pesticides and other pollutants to the Great Barrier Reef, State of Queensland, Brisbane.
  • 1816. Furnas, M. 2003, Catchments and corals: Terrestrial runoff to the Great Barrier Reef, Australian Institute of Marine Science, Townsville.
  • 1819. Prosser, I.P. and Wilkinson, S.N. 2024, 2022 Scientific Consensus Statement: Summary | Evidence Statement for Question 3.3: How much anthropogenic sediment and particulate nutrients are exported from GBR catchments? in 2022 Scientific Consensus Statement on land-based impacts on Great Barrier Reef water quality and ecosystem condition, eds J. Waterhouse, M. Pineda and K. Sambrook, Commonwealth of Australia and Queensland Government.
  • 1825. Commonwealth of Australia and State of Queensland 2018, Reef 2050 Water Quality Improvement Plan 2017-2022, Reef Water Quality Protection Plan Secretariat, Brisbane.
  • 1826. Queensland Department of Environment and Science 2018, Catchment targets: Reef 2050 Water Quality Improvement Plan 2017-2022, Reef Water Quality Protection Plan Secretariat, <https://www.reefplan.qld.gov.au/water-quality-and-the-reef/the-plan/targets/catchment-targets>.
  • 1827. State of Queensland 2022, Reef Water Quality Report Card 2020, Commonwealth Government and Queensland Government, Brisbane.
  • 1828. Warne, M., Neelamraju, C., Strauss, J., Smith, R.A., Turner, R.D.R., Mann, R.M. 2020, Development of a Pesticide Risk Baseline for the Reef 2050 Water Quality Improvement Plan, Department of Environment and Science, Brisbane.
  • 1829. Reinier, M., Turner, D.R., Neelamraju, C., Orr, D., Ferguson, B., et al. 2023, Great Barrier Reef Catchment Loads Monitoring Program: Loads and yields for sediment and nutrients, and Pesticide Risk Metric results (2020–2021) for rivers that discharge to the Great Barrier Reef, Department of Environment, Science and Innovation, Brisbane.
  • 1830. Kaserzon, S., Shiels, R., Elisei, G., Paxman, C., Li, Y., Carswell, C., Xia, S., Prasad, P., Gallen, M., Reeks, T., Thompson, K., Taucare, G., Marano, K., Gorji, S.G., Mueller, J. 2024, Marine Monitoring Program: annual report for inshore pesticide monitoring 2022–23. Report for the Great Barrier Reef Marine Park Authority, Great Barrier Reef Marine Park Authority, Townsville.
  • 1831. Prosser, I.P. and Wilkinson, S.N. 2024, 2022 Scientific Consensus Statement: Summary | Evidence Statement for Question 4.4: How much anthropogenic dissolved nutrient (nitrogen and phosphorus species) is exported from GBR catchments? in 2022 Scientific Consensus Statement on land-based impacts on Great Barrier Reef water quality and ecosystem condition, eds J. Waterhouse, M. Pineda and K. Sambrook, Commonwealth of Australia and Queensland Government.
  • 1832. Devlin, M., Schaffelke, B. 2009, Spatial extent of riverine flood plumes and exposure of marine ecosystems in the Tully coastal region, Great Barrier Reef, Marine and Freshwater Research 60(11): 1109-1122.
  • 1833. Furnas, M., Mitchell, A., Skuza, M. and Brodie, J. 2005, In the other 90%: phytoplankton responses to enhanced nutrient availability in the Great Barrier Reef Lagoon, Marine Pollution Bulletin 51(1-4): 253-265.
  • 1834. Bell, P.R.F. 2021, Analysis of satellite imagery using a simple algorithm supports evidence that Trichodesmium supplies a significant new nitrogen load to the GBR lagoon, Ambio 50(6): 1200-1210.
  • 1835. Sohm, J.A., Webb, E.A. and Capone, D.G. 2011, Emerging patterns of marine nitrogen fixation, Nature Reviews Microbiology 9(7): 499-508.
  • 1836. Waterhouse, J., Brodie, J., Lewis, S. and Mitchell, A. 2012, Quantifying the sources of pollutants in the Great Barrier Reef catchments and the relative risk to reef ecosystems, Marine Pollution Bulletin 65(4-9): 394-406.
  • 1837. Mitchell, A., Reghenzani, J., Faithful, J., Furnas, M., Brodie, J. 2009, Relationships between land use and nutrient concentrations in streams draining a ‘wet-tropics’ catchment in northern Australia, Marine and Freshwater Research 60(11): 1097-1108.
  • 1838. Stanley, J. and Reading, L. 2020, Nitrate dynamics in groundwater under sugarcane in a wet-tropics catchment, Heliyon 6(12): e05507.
  • 1839. Brodie, J., Lewis, S., Wooldridge, S., Bainbridge, Z., Waterhouse, J., Honchin, C. 2015, Ecologically relevant targets for pollutant discharge from the drainage basins of the Fitzroy Region, Great Barrier Reef, James Cook University, Townsville.
  • 1840. Devlin, M. and Brodie, J. 2023, Nutrients and Eutrophication, in Marine Pollution – Monitoring, management and mitigation, ed. A. Reichelt-Brushett, Springer, Cham, pp. 75-100.
  • 1841. Bainbridge, Z., Olley, J., Wilkinson, S., Bartley, R., Lewis, S., et al. 2023, Refining fine sediment source identification through integration of spatial modelling, concentration monitoring and source tracing: A case study in the Great Barrier Reef catchments, The Science of the Total Environment 892: 164731.
  • 1842. D'Olivo, J.P. and McCulloch, M. 2022, Impact of European settlement and land use changes on Great Barrier Reef river catchments reconstructed from long-term coral Ba/Ca records, The Science of the Total Environment 830: 154461.
  • 1843. Kroon, F.J., Kuhnert, P.M., Henderson, B.L., Wilkinson, S.N., Kinsey-Henderson, A., et al. 2012, River loads of suspended solids, nitrogen, phosphorus and herbicides delivered to the Great Barrier Reef lagoon, Marine Pollution Bulletin 65(4-9): 167-181.
  • 1844. Lewis, S., Packett, R., Dougall, C., Brodie, J., Bartley, R., et al. 2015, Fitzroy sediment story. A Report for the Fitzroy Basin Association. Report No. 15/74, TropWater (Centre for Tropical Water & Aquatic Ecosystem Research), James Cook University, Townsville.
  • 1845. Taucare, G., Bignert, A., Kaserzon, S., Thai, P., Mann, R.M., et al. 2022, Detecting long temporal trends of photosystem II herbicides (PSII) in the Great Barrier Reef lagoon, Marine Pollution Bulletin 177: 113490.
  • 1846. Skerratt, J., Baird, M.E., Mongin, M., Ellis, R., Smith, R.A., et al. 2023, Dispersal of the pesticide diuron in the Great Barrier Reef, The Science of the Total Environment 879: 163041.
  • 1847. Brodie, J. and Landos, M. 2019, Pesticides in Queensland and Great Barrier Reef waterways - potential impacts on aquatic ecosystems and the failure of national management, Estuarine, Coastal and Shelf Science 230: 106447.
  • 1848. Spilsbury, F.D., Warne, M.S.J. and Backhaus, T. 2020, Risk Assessment of Pesticide Mixtures in Australian Rivers Discharging to the Great Barrier Reef, Environmental Science & Technology 54(22): 14361-14371.
  • 1849. Negri, A.P., Taucare, G., Neale, P., Neelamraju, C., Kaminski, H., et al. 2024, 2022 Scientific Consensus Statement: Summary | Evidence Statement for Question 5.1: What is the spatial and temporal distribution of pesticides across GBR ecosystems? What are the (potential or observed) ecological impacts in these ecosystems? What evidence is there for pesticide risk? in 2022 Scientific Consensus Statement on land-based impacts on Great Barrier Reef water quality and ecosystem condition, eds J. Waterhouse, M. Pineda and K. Sambrook, Commonwealth of Australia and Queensland Government.
  • 1850. Warne, M.St.J., Neelamraju, C., Strauss, J., Smith R.A., Turner, R.D.R., Mann, R.M. 2020, Development of a method for estimating the toxicity of pesticide mixtures and a Pesticide Risk Baseline for the Reef 2050 Water Quality Improvement Plan, Queensland Government, Brisbane.
  • 1851. Prazeres, M., Gruber, R., Howley, C., Lewis, S., McKenzie, L., et al. 2024, Great Barrier Reef Marine Monitoring Program: Synthesis Report 2022–23, Great Barrier Reef Marine Park Authority, Townsville.
  • 1852. Warne, M.S.J., Neelamraju, C., Strauss, J., Turner, R.D.R., Smith, R.A., et al. 2023, Estimating the aquatic risk from exposure to up to twenty-two pesticide active ingredients in waterways discharging to the Great Barrier Reef, The Science of the Total Environment 892: 164632.
  • 1853. Water Quality & Investigations 2023, Pesticide Risk Metric Dashboard, Department of Environment and Science, Queensland Government, Brisbane, <https://prmdashboard.des.qld.gov.au/>.
  • 1854. King, O.C., Smith, R.A., Warne, M.S.J., van de Merwe, J.P., Connolly, R.M., et al. 2021, Combined impacts of photosystem II-inhibiting herbicides and light availability on seagrass and marine microalgae, Marine Ecology Progress Series 668: 215-230.
  • 1855. Thai, P., Paxman, C., Prasad, P., Elisei, G., Reeks, T., Eaglesham, G., Yeh, R., Tracey, D., Grant, S., Mueller, J. 2020, Marine Monitoring Program: Annual Report for inshore pesticide monitoring 2018-19. Report to the Great Barrier Reef Marine Park Authority, Great Barrier Reef Marine Park Authority, Townsville.
  • 1856. Gallen, C., Thai, P., Paxman, C., Prasad, P., Elisei, G., et al. 2019, Marine Monitoring Program: Annual Report for Inshore Pesticide Monitoring 2017-2018, Great Barrier Reef Marine Park Authority, Townsville.
  • 1857. Waterhouse, J., Gruber, R., Logan, M. Petus, C., Howley, C., et al. 2021, Marine Monitoring Program: Annual report for inshore water quality monitoring 2019-20, Great Barrier Reef Marine Park Authority, Townsville.
  • 1858. Beaumont, N.J., Aanesen, M., Austen, M.C., Börger, T., Clark, J.R., et al. 2019, Global ecological, social and economic impacts of marine plastic, Marine Pollution Bulletin 142: 189-195.
  • 1859. Rahman, M.N., Shozib, S.H., Akter, M.Y., Islam, A.R.M.T., Islam, M.S., et al. 2023, Microplastic as an invisible threat to the coral reefs: Sources, toxicity mechanisms, policy intervention, and the way forward, Journal of Hazardous Materials 454: 131522.
  • 1860. Gall, S.C. and Thompson, R.C. 2015, The impact of debris on marine life, Marine Pollution Bulletin 92(1-2): 170-179.
  • 1861. Critchell, K., Bauer-Civiello, A., Benham, C., Berry, K., Eagle, L., et al. 2019, Plastic pollution in the coastal environment: current challenges and future solutions, in Coasts and Estuaries, eds E. Wolanski, J.W. Day, M. Elliott and R. Ramachandran, Elsevier, pp. 595-609.
  • 1862. Rochman, C.M., Browne, M.A., Underwood, A.J., Van Franeker, J.A., Thompson, R.C., et al. 2016, The ecological impacts of marine debris: unraveling the demonstrated evidence from what is perceived, Ecology 97(2): 302-312.
  • 1863. Gacutan, J., Johnston, E.L., Tait, H., Smith, W. and Clark, G.F. 2022, Continental patterns in marine debris revealed by a decade of citizen science, The Science of the Total Environment 807(Pt 2): 150742.
  • 1864. Gacutan, J., Tait, H., Johnston, E.L. and Clark, G.F. 2023, Assessing human and physical drivers of macro-plastic debris spatially across Queensland, Australia, Environmental Pollution 330: 121731.
  • 1865. Smith, C.E., Gilby, B.L., van de Merwe, J., Jones, J., Tait, H., et al. 2024, Predictive modelling reveals Australian continental risk hotspots for marine debris interactions with key threatened species, Global Change Biology 30: e17313.
  • 1866. Australian Marine Debris Initiative and Tangaroa Blue Foundation. 2023, ReefClean 2022, tackling marine debris pollution on the Great Barrier Reef, Australian Marine Debris Initiative National – Tangaroa Blue, Australia.
  • 1867. Kroon, F.J., Berry, K.L.E., Brinkman, D.L., Kookana, R., Leusch, F.D.L., et al. 2020, Sources, presence and potential effects of contaminants of emerging concern in the marine environments of the Great Barrier Reef and Torres Strait, Australia, Science of the Total Environment 719: 135140.
  • 1868. Miller, M.E., Santana, M.F.M., Carsique, M., Motti, C.A., Hamann, M., et al. 2022, Temporal patterns of plastic contamination in surface waters at the SS Yongala shipwreck, Great Barrier Reef, Australia, Environmental Pollution 307: 119545.
  • 1869. Carbery, M., Herb, F., Reynes, J., Pham, C.K., Fong, W., et al. 2022, How small is the big problem? Small microplastics Marine Pollution Bulletin 184: 114179.
  • 1870. Hardesty, B.D., Wilcox, C., Lawson, T.J., Lansdell, M., van der Velde, T. 2014, Understanding the effects of marine debris on wildlife, Commonwealth Scientific and Industrial Research Organisation, Hobart.
  • 1871. Australian Microplastic Assessment Project 2023, Final overview of microplastics across GBR catchments: 2019-2023, Australian Microplastic Assessment Project (AUSMAP), Australia.
  • 1872. Roman, L., Warmbrunn, A., Lawson, T.J., Willis, K., Wilcox, C., et al. 2021, Comparing marine anthropogenic debris on inhabited mainland beaches, coastal islands, and uninhabited offshore islands: a case study from Queensland and the Coral Sea, Australia, Marine Pollution Bulletin 172: 112919.
  • 1873. Agamuthu, P., Mehran, S.B., Norkhairah, A. and Norkhairiyah, A. 2019, Marine debris: A review of impacts and global initiatives, Waste Management & Research 37(10): 987-1002.
  • 1874. Department of Climate Change Energy the Environment and Water 2023, Grant funding available to reduce marine debris impact on the Reef, Commonwealth of Australia, <https://www.dcceew.gov.au/about/news/grant-funding-available-reduce-marine-debris-impact-reef>.
  • 1875. Chariton, A. and Hejl, N. 2024, 2022 Scientific Consensus Statement: Summary | Evidence Statement for Question 6.1: What is the spatial and temporal distribution and risk of other pollutants in the GBR ecosystems, and what are the primary sources? in 2022 Scientific Consensus Statement on land-based impacts on Great Barrier Reef water quality and ecosystem condition, eds J. Waterhouse, M. Pineda and K. Sambrook, Commonwealth of Australia and Queensland Government.
  • 1876. Tebbett, S.B., Bellwood, D.R., Johnson, E.R. and Chase, T.J. 2022, Occurrence and accumulation of heavy metals in algal turf particulates and sediments on coral reefs, Marine Pollution Bulletin 184: 114113.
  • 1877. . Heffernan, A.L., del Mar Gómez-Ramos, M., Villa, C.A., Bell, I.P. and Gómez-Ramos, M.J. 2022, Untargeted screening of xenobiotics and metabolic profiles of green sea turtles on the Great Barrier Reef, in Applied Environmental Metabolomics, eds Beale, D. J., Hillyer, K. E., A.C. Warden and O.A.H. Jones, Academic Press, London, pp. 167-181.
  • 1878. Gallen, C., Heffernan, A.L., Kaserzon, S., Dogruer, G., Samanipour, S., et al. 2018, Integrated chemical exposure assessment of coastal green turtle foraging grounds on the Great Barrier Reef, Science of The Total Environment 657: 401-409.
  • 1879. van Dam, J.W., Negri, A. P., Uthicke, S., Mueller, J. F. 2011, Chemical pollution on coral reefs: exposure and ecological effects, in Ecological impacts of toxic chemicals, ed. Sánchez-Bayo, F., van den Brink, P. J., Mann, R. M., Bentham Science Publisher, United Arabic Emirates, pp. 187-211.