More than 99 per cent of Australia’s international trade occurs via sea.1449 Shipping provides a critical servicing role and supports the economy through both imports and exports. Nationally, the total volume of cargo moving across Australian wharves in the 2020–21 financial year decreased by 1.2 per cent, which contrasted with the average annual trend growth of 1.4 per cent in the preceding 5 years to 2020–21. In 2020–21, the number of port calls by all cargo ships at Australian ports dropped by 1.2 per cent compared to 2019–20. This continued the 9.3 per cent drop seen in 2019–20.1450
Approximately 3000 ships transited through the Region between 2019 and 2022
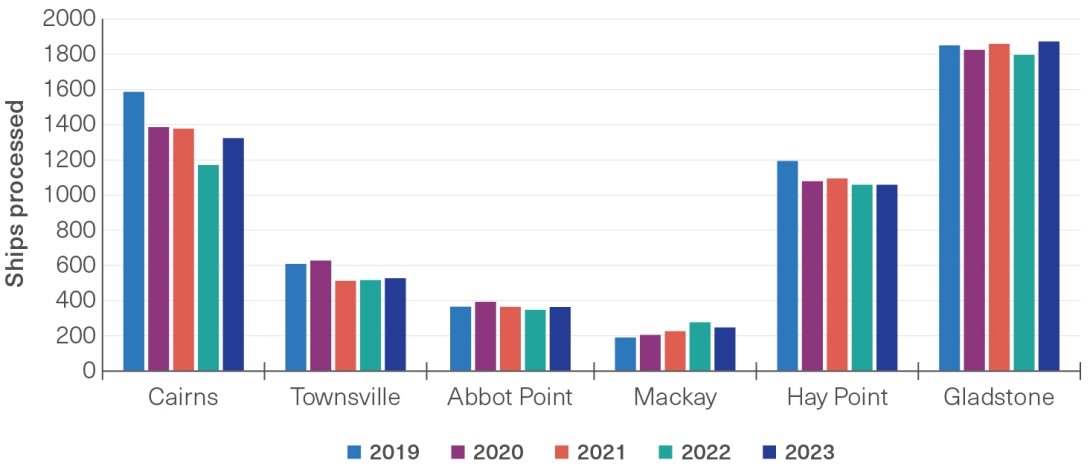
Each year from 2019 to 2022, approximately 3000 ships transited through the Region and approximately 11,000 voyages were made (Figure 5.19). Since 2019, the number of ships processed through most major ports declined (Figure 5.20), and the throughput (amount of imported and exported) tonnage has reduced by more than 9 per cent within Queensland ports within the Region (Section 5.7.2).1424 This is likely due to impacts from the COVID-19 pandemic on global maritime mobility.
Figure 5.19
Ships visiting the Region, 2013 to 2022
Total number of ships visiting the Region per calendar year and the total number of voyages made by those ships within the calendar years between 2013 and 2017. The ships include coal carriers, bulk carriers, container carriers, vehicle carriers, general cargo ships, tankers and cruise ships (fishing, other tourism and recreational vessels are not included). A voyage is a movement within the Reef and Torres Strait Vessel Traffic Service (Reef VTS). For example, a ship transiting from Palm Passage to Townsville is one voyage; another voyage is logged when the same ship departs Townsville and exits at Palm Passage. Source: Reef VTS (2023)1451
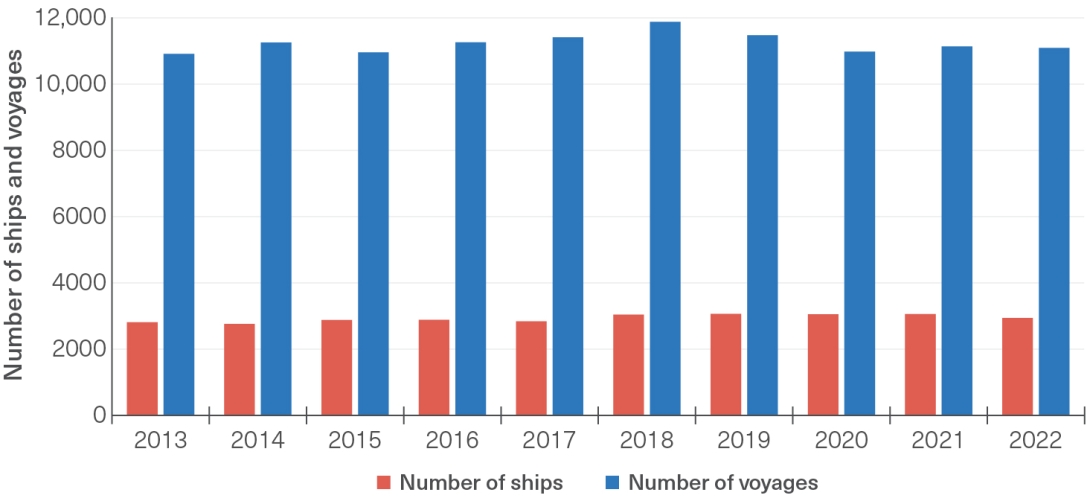
Figure 5.20
Ships processed by major trading ports in the Region, 2019 to 2022
Ships include trade (bulk carriers, gas, tankers, general cargo) and non-trade vessels (passenger, tug and tows, naval). Processed means a ship loads, unloads or does both. Source: Far North Queensland Ports Corporation Limited (trading as Ports North), Port of Townsville Limited, Gladstone Port Corporation Limited and North Queensland Bulk Port Corporation Limited (2023)1410
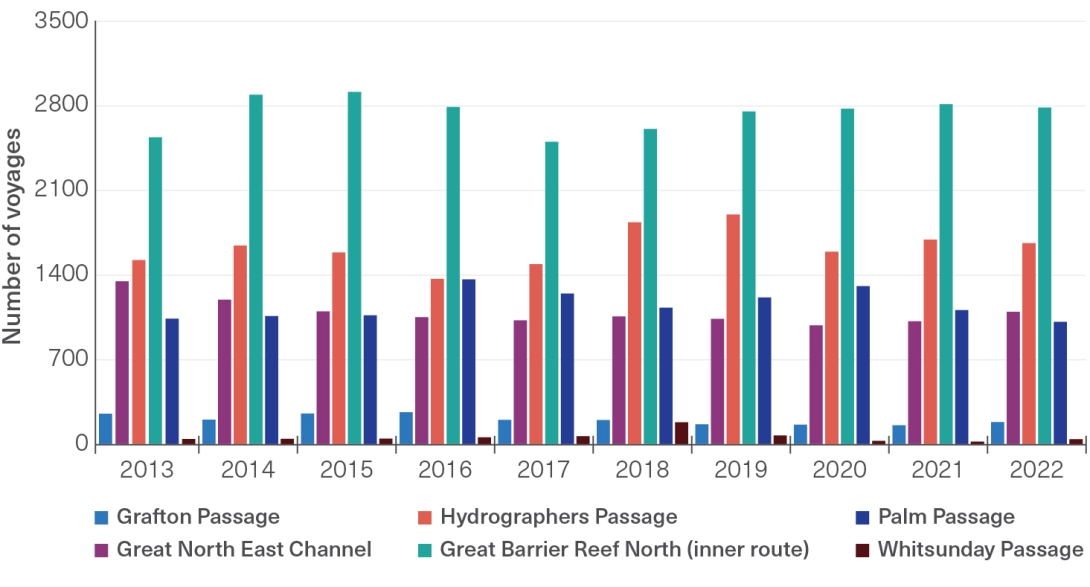
Ships are required to navigate through the Region within the designated shipping area (Figure 5.21) or the General Use Zones of the Marine Park. Navigation outside these areas in the Marine Park requires permission from the Reef Authority.1452 A formalised two-way shipping route in the Great Barrier Reef and Torres Strait encourages shipping traffic to use established lanes that separate northbound and southbound traffic. Vessels that transit the Reef enter using one of six major shipping channels (or passages) (Figure 5.22). The busiest shipping passage in the Region is the Inner Route — Cape York to Cairns.1451 Since 2019, there has been a decrease in the use of Hydrographers Passage, Palm Passage and the Whitsunday Area, while all other main passages have seen an increase in the number of voyages.
Figure 5.21
Major shipping channels and shipping density
Top: Map of shipping routes and designated shipping area in the Region. Bottom: A ‘hexmap’ representing the total number of detections of vessels in each hexagon for June 2023. Data have been transformed using a natural logarithm for vessel counts. June 2023 data used in the Outlook Report 2024 with the permission of Marine Traffic. However, Marine Traffic has not evaluated the data as altered and incorporated within the Outlook Report 2024, and, therefore, gives no warranty regarding its accuracy, completeness, currency or suitability for any particular purpose. Source: Marine Traffic (2023)1453
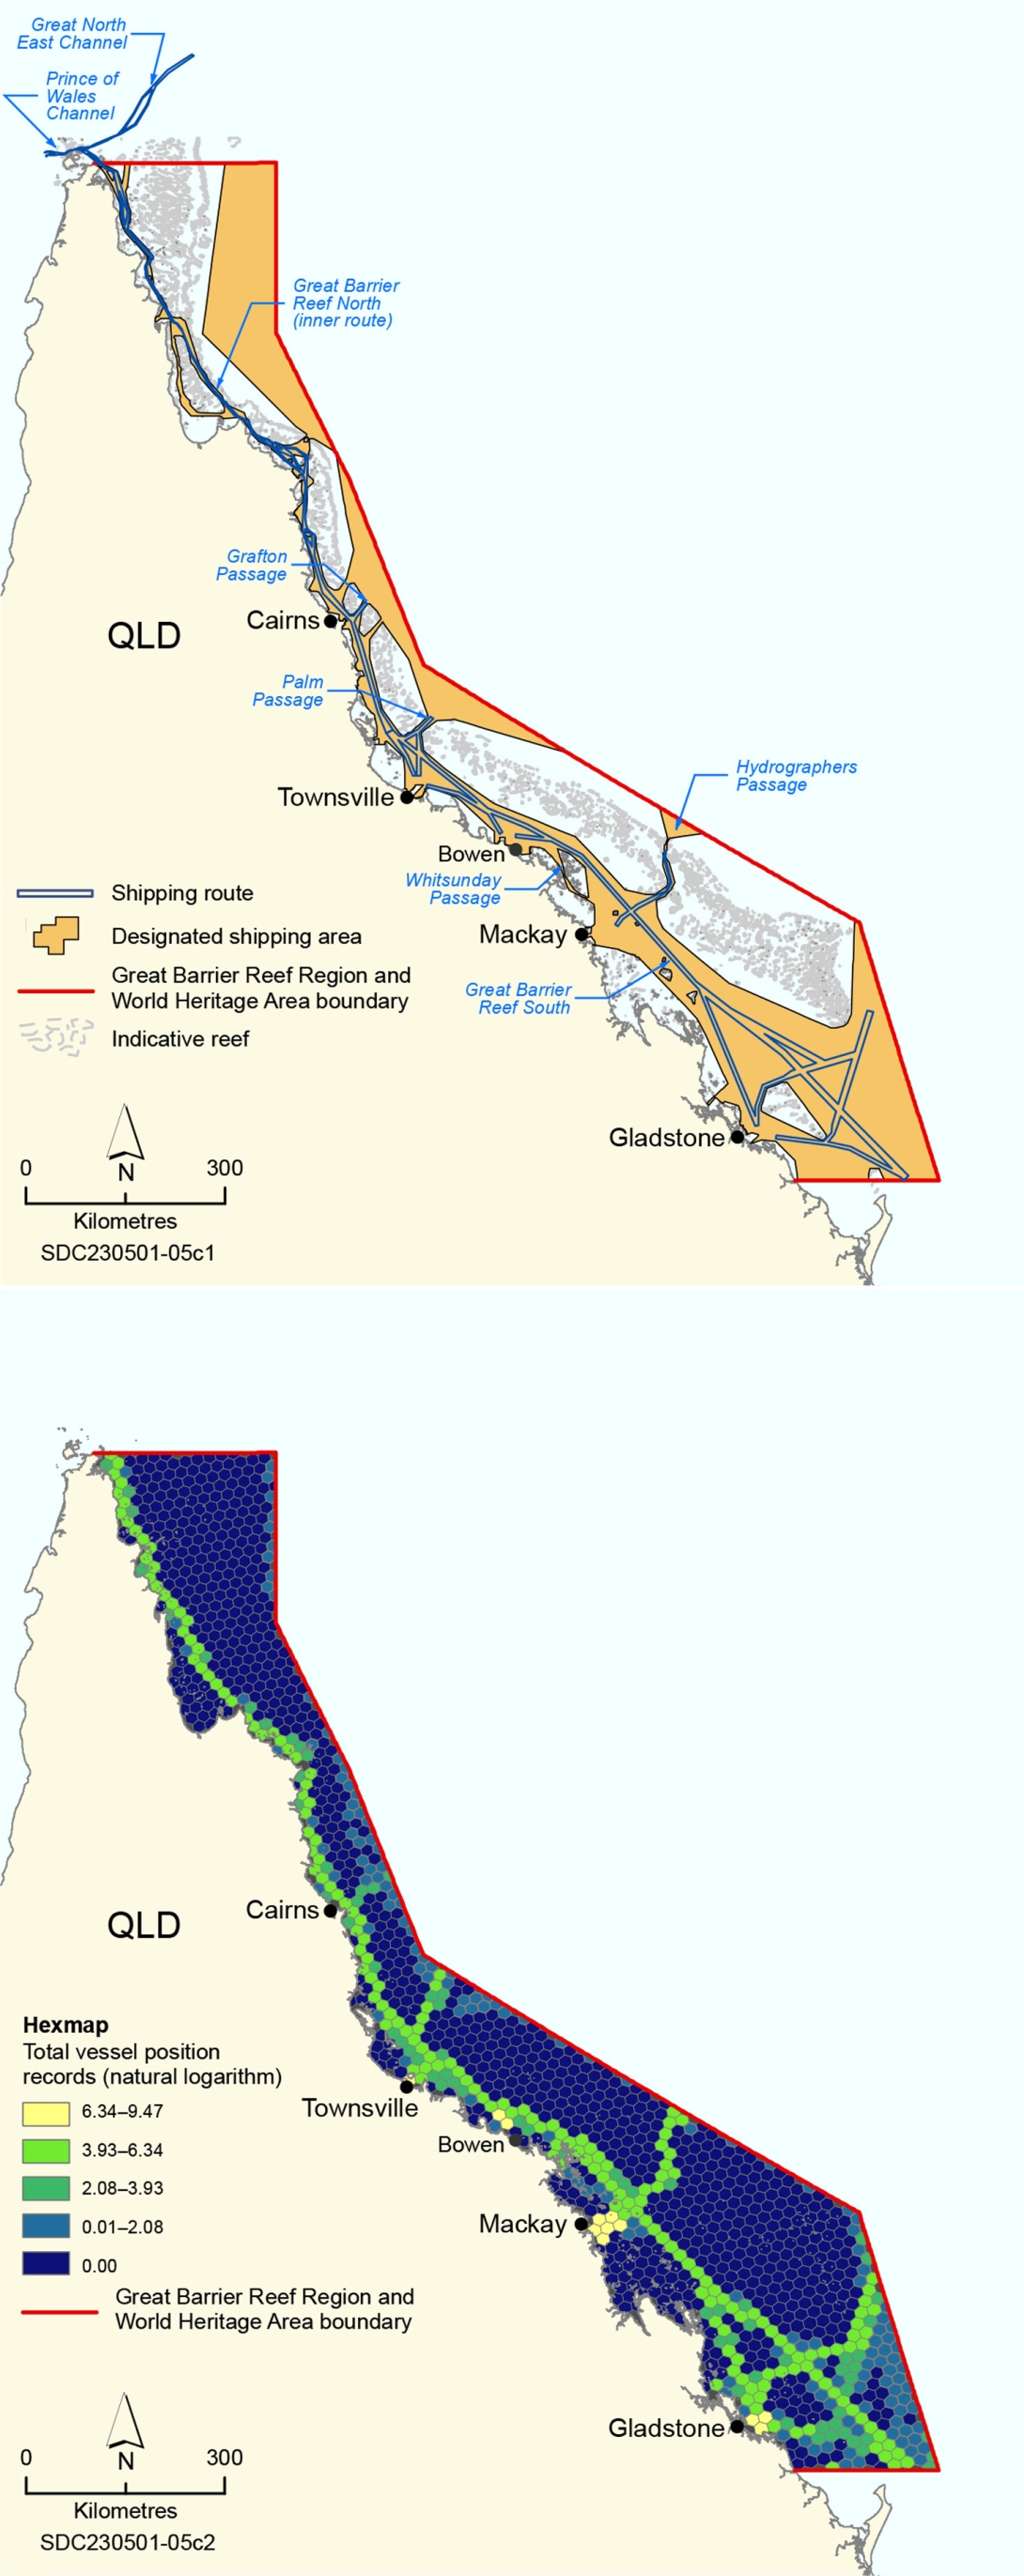
Figure 5.22
Total number of voyages through the six main passages that enable ships to enter the Reef via the designated shipping channel, 2013 to 2022
The vessels making these voyages include coal carriers, bulk carriers, container carriers, vehicle carriers, general cargo ships, tankers and cruise ships. Fishing, other tourism and recreational vessels are not included. Source: Reef VTS (2023).1451
The Region is home to four active cruise ship berths, in Bundaberg, Gladstone, Townsville and Cairns, and many cruise ship anchorages.1454 In the 2022–23 financial year, Cairns and Whitsundays were the most visited areas. The Funnel Bay anchorage in the Whitsundays was the most used in the Region.1455 In 2020, the Cairns Shipping Development Project was completed.1456 The project, which widened and deepened the existing Trinity Inlet shipping channel, facilitates cruise ships up to 300 metres in length to enter. Forecasted annual demand of up to 150 cruise ships through the Port of Cairns is expected by 2031 (in total). A similar project is underway in Townsville and due for completion in 2024.1457
Management of the COVID-19 pandemic affected global maritime mobility, especially during March to June 2020 when the most severe restrictions were in force.1458 Reductions in several commodity carriers were documented. For example, internationally, container ships experienced between 6 and 14 per cent reduction; however, the impacts of the COVID-19 pandemic management measures on container ships in Queensland were limited.1459 Internationally, passenger ships were down between 19 and 43 per cent during March to June 2020.1458 In Australia, cruise ship activity was halted between March 2020 and April 2022, resulting in significant economic impacts. Since resuming, the Australian cruise ship industry has shown strong recovery and contributed $5.6 billion in direct and indirect output to the Australian economy in the financial year 2022–23 (up from $4.6 billion in 2018–19).1460
Globally, the market for superyachts has increased in recent years, from 755 global orders in 2016 to 1024 in 2022.1461 More than 6600 superyachts are expected to exist worldwide by 2025.1461 In Australian waters, around 364 superyachts were operating during the 2019–20 superyacht season (September to March). Approximately 25 per cent of these were greater than 25 metres in length. Around 40 to 60 per cent of superyachts operating in Australia are used for recreational purposes.1461 Global mobility, because of COVID-19 restrictions, significantly affected the superyacht chartering sector, but there is an average expected increase in superyacht activity of 7.5 per cent in Queensland.1461 The Queensland Superyacht Strategy (2018–2028) aims to grow Queensland’s share of the Australian superyacht sector to 90 per cent by 2028.
Management | The Reef is designated as a Particularly Sensitive Sea Area by the International Maritime Organization. Shipping activities are managed by multiple government agencies. The Australian Maritime Safety Authority, along with Maritime Safety Queensland and the Reef Authority, administer special measures under international and domestic law to regulate ship activities. Shipping management is coordinated through the North-East Shipping Management Plan, which sets out preventative measures to reduce environmental impacts from shipping activities (Section 5.8.3).
Ships transiting through the Region must comply with the zoning plans and designated shipping areas, unless provided with a permission. Pilotage of ships greater than 70 metres in length (and oil tankers, chemical carriers and liquified gas carriers (irrespective of length)) is compulsory within the inner shipping route, Hydrographers Passage and within the Whitsundays. Pilots are licensed by the Australian Maritime Safety Authority to assist ships to safely navigate through the Region.
The Queensland Government is responsible for vessel tracking services and operates five tracking centres for ports and surrounding waterways. The operation of the Great Barrier Reef and Torres Strait Vessel Traffic Service (Reef VTS) provides 24-hour monitoring and tracking of all shipping traffic within the Region. This service can divert ships in the event of a possible traffic conflict, intervene to prevent a maritime incident, monitor maritime incidents, support investigations of potential breaches of legislation, and support effective response to incidents. Since 2019, this service has been divided into Reef VTS north (based in Townsville) and south (based in Gladstone) to provide greater oversight and redundancy (for example, in case of shutdowns due to cyclones).
Regular inspections by the Australian Maritime Safety Authority at ports aims to ensure all ships (including foreign vessels) are in working order, compliant with relevant legislation and safe. Ships can be detained if they are noncompliant and deemed to pose a risk to human safety or the environment (for example, ships carrying introduced pests). The Guideline for Vetting Bulk Carriers Intended for Travel Through the Great Barrier Reef (2020)1462 provides guidance to the maritime industry for adopting of ship vetting processes and managing risk associated with travel through the Great Barrier Reef. This guideline includes consideration of the quality of the ship, competence of the crew, ship emissions and general protection of the marine environment.
Ships visiting ports to load and unload cargo may need to anchor near a port to wait for a scheduled berth. Established anchorages are designated adjacent to Cairns, Townsville, Hay Point, Abbot Point and Gladstone ports. Some anchorage areas do not have designated anchorage points, and there is no single state regulator for designating and approving anchorages; nor are there standard processes to follow.
Commercial superyachts greater than 50 metres in length that visit the Region comply with the same management rules as other similar-sized vessels, as they pose a similar threat. These yachts participate in the Reef VTS, and superyachts greater than 70 metres in length require a ship pilot to be onboard within compulsory pilotage areas. Recreational superyachts must also comply with these requirements but do not need to remain within the General Use Zone or Designated Shipping Areas. In the frequently visited areas, Cairns, Hinchinbrook and Whitsundays, special management strategies are in place to manage use, and they apply to vessel length, group size and ancillary craft (jet skis and helicopters).
Bookings to use designated cruise ship anchorages aim to provide an uncongested safe anchorage in places where the seafloor is mostly non-coral with limited habitat structure and to allow the values of desirable locations to be presented to tourists (for example, around the Whitsunday and Hinchinbrook islands). Access to locations by the support tender vessels that service cruise ships are also managed closely, restricting the number of visits by group size and vessel size in high-use locations. Superyachts greater than 50 metres are also required to book to use these designated anchorages.
Ships (including cruise ships) accumulate waste during transit in the form of wastewater (oily water, sewage, grey water and wastewater associated with onboard equipment) and garbage (for example, food waste and plastics). Australia is party to all six annexes of the International Convention for the Prevention of Pollution from Ships (MARPOL). These include Annex I,1463 which regulates for the prevention of pollution by oil, and Annex V,1464 which regulates garbage pollution from ships. Discharge of plastic into the sea has been prohibited under Annex V since 1988, and discharge of all types of garbage into the sea, with very limited exceptions (not related to plastics), has been prohibited since 2013. These limited exceptions are permitted to be discharged at a distance away from land.
In Australia, the obligations under MARPOL are given effect under Protection of the Sea (Prevention of Pollution from Ships) 1983 (Cth). MARPOL defines nearest land for north-east Australia by coordinates which are generally the boundary of the Reef. Sewage discharges in the Region need to be in accordance with Annex IV of MARPOL 1465 or, for domestic voyages, in accordance with requirements of Marine Park regulations for both treated and untreated sewage. Grey water may be discharged within the Marine Park as far as practicable from reefs and islands. Roll back provisions are in place for states and territories to give effect to MARPOL in their coastal waters. Queensland gives effect to Annexes I to V in the Transport Operations (Marine Pollution) Act 1995 (Qld) and Transport Operations (Marine Pollution) Regulation 2018 but not Annex VI (air pollution).
In 2020, the International Maritime Organization (IMO) introduced the ‘IMO 2020’ rule which limits the sulfur in fuel oil used on ships operating outside designated emission control areas.1466 This new limit was made compulsory following an amendment to Annex VI of the MARPOL, which is the main international convention for addressing ship‑sourced pollution.
The International Maritime Organization adopted an updated strategy on the reduction of greenhouse gas emissions from ships in 2023 which aims to reach net-zero greenhouse gas emissions from international shipping around 2050. Efforts to reduce emissions within the shipping industry have resulted in a transition from heavy fuel oil to alternative fuel sources such as hydrogen.1467 Burning hydrogen fuels has zero carbon emission and, when produced using a renewable energy-based approach, has lower emissions than fossil-based hydrogen generation.1467,1468
During 2019 to 2020, the Queensland Department of Agriculture and Fisheries, in partnership with port authorities, implemented the Q-SEAS pilot program.1469 The Q-SEAS program aims to enhance early detection of the presence of invasive marine species in potentially high-risk areas within berthing areas at the ports of Gladstone, Mackay, Townsville and Cairns.

