3.2.5 Sea level

Sea level varies throughout the world’s oceans due to variations in the pull of gravity, the temperature and salinity of the water, the pressure of the atmosphere above the ocean surface and the movement of ocean currents.607 These factors combine to create a surface with a natural slight topography of hills and valleys that vary in height by up to 2 metres. Climate phenomena, such as El Niño and La Niña can cause cyclical variations in sea level of 20 to 30 centimetres over years or decades.608 Superimposed on this uneven surface are the normal, frequent fluctuations in sea level, such as those associated with tides, storm surges, and ocean waves (swell and wind waves), in the order of metres.

Figure 3.7
Sea level trends around Australia

Contours show offshore sea level trends measured by satellite altimeters from December 1992 to February 2024. Coloured dots show coastal sea-level rise from the Permanent Service for Mean Sea Level (PSMSL) multi-decadal tide gauge dataset over the same time period. The table provides relative sea level trend data in millimetres per year for 5 tide gauge stations within the Region for the periods 1966–2023 and 1993–2023 compared to global mean sea level (GMSL). * Asterisk indicates insufficient data are available to assess trends for this period. Source: CSIRO (2024)616 using altimetry data provided by the NOAA Laboratory for Satellite Altimetry.617 Tide gauge records are from PSMSL.618,619 GMSL observation considers an ensemble of tide gauge reconstructions (1966–1993) and satellite observation (1993–2023).620,621
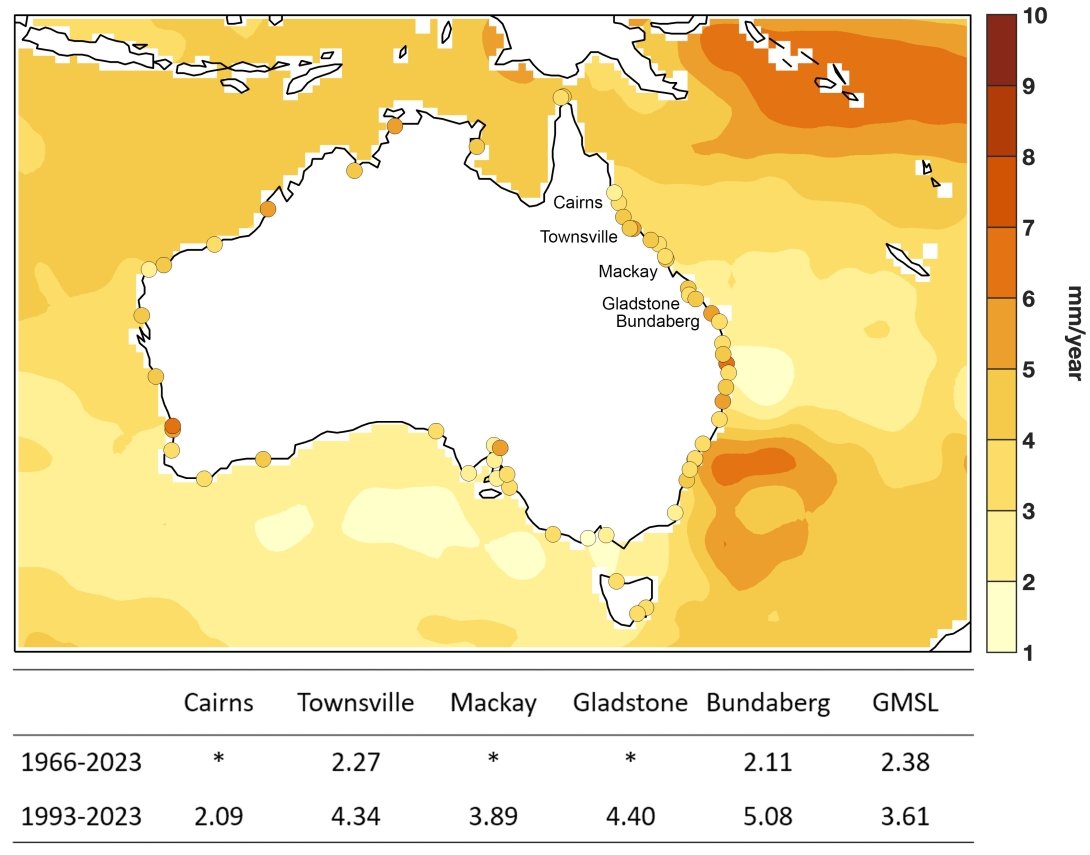
This figure includes a map and a table.  The map of Australia shows sea level trends based on satellite altimeters. On the Reef, the sea level rise between December 1992 to February 2024 ranges from 2 to 5 mm / year.  The table has 3 rows and 7 columns. The first row includes column headings. The first column header cell is blank, but the column includes the time range. In the first row, the time range is 1966 to 2023. In the second row, the time range is 1993 to 2023.

Sea levels have been monitored with near-global coverage using satellites for more than 25 years, while a network of tide gauges has provided more detailed local and regional records for more than a century.609,610,611 Remote sensing data suggest that offshore sea levels within the Region rose at a rate of around 3 to 4 millimetres annually between 1993 and 2020 540 (Figure 3.7). Over a similar period, data from coastal tide gauges indicate that sea levels have risen around 2 millimetres per year near Cairns, Townsville and Gladstone, and by 3 to 4 millimetres per year at Mackay and Bundaberg.612 In both Townsville and Bundaberg, where sufficient data are available to assess longer-term trends, a higher rate of sea-level rise is reported in more recent years (1993 to 2019) than over the longer time period (1966 to 2019).612

Globally, average sea levels are rising as a direct consequence of anthropogenic global warming.613 Two main processes are driving this: thermal expansion (an increase in the volume of sea water as it warms) and increased melting of land-based ice.540,614 Global average sea level rose faster during the twentieth century than in any prior century during the past 3000 years and this rise has accelerated since the late 1960s to around 4 millimetres per year 582,608,615 (Section 6.3.1). The rise is increasingly due to the loss of land ice, and recent increases in meltwater from Greenland and Antarctica have made this process the largest contributor to global sea level rise since 2006.608

Sea level rise is likely to continue to accelerate and will continue for centuries

The effect of sea level rise on coastlines depends on numerous factors, including vertical land movements and ocean circulation changes, in addition to the factors driving global sea-level rise.622,623 Human communities and coastal ecosystems are affected by the local height of the ocean relative to the coastline,624,625 referred to as relative sea level.  Sea level rise, though incremental, is likely to continue to accelerate in coming decades and will continue for centuries even if strong global action is taken to reduce greenhouse gas emissions 608 (Section 6.3.1).

The natural fluctuations in sea level caused by weather, tides and ocean swell create occasional extremes of sea level such as king tides and storm surges, which can cause serious damage to coastal ecosystems, infrastructure and communities. As average sea levels rise, these extreme events will be superimposed on a higher baseline, increasing the environmental and economic impacts of coastal flooding and erosion.540,553,626 

In Townsville, the frequency of occurrence of coastal inundation has been doubling every 34 years since 1959.612 Species such as marine turtles and seabirds that rely on low-lying beaches and cays for nesting and breeding are also at high risk from sea-level rise.627,628 If increases in the Region are similar to the global average, extreme sea level events that in the recent past occurred around once per century will occur about 20 to 30 times as often by 2050 and 160 to 530 times as often by 2100.608,629

Sea-level rise is also expected to interact with the complex bathymetry of the Reef to locally increase or decrease tidal ranges, so some coastal areas will be more affected than others.630 A range of factors such as such as local sediment supply also affect how habitats respond on different timescales. For example, mangrove forests on low wooded islands have expanded over recent decades likely due to increased habitat availability linked to sea-level rise.123

Current impacts from sea-level rise are often difficult to disentangle from individual weather events and cyclical variations, such as those driven by El Niño. For example, beach erosion is influenced by a local combination of human activities, current-induced sediment transport and storm events.109 Rising sea levels are an emerging and inevitable future threat to Reef ecosystems (Section 6.3.2) and coastal communities (Section 6.3.3). Early impacts of accelerating sea-level rise at sheltered or subsiding coasts are likely to include chronic flooding at high tides, wetland salinisation and ecosystem shifts, increased erosion, coastal flood damage and increased vulnerability of low-lying islands.96,109 The disproportionate concentration of economic development in and around coastal settlements means that future risk to many of the Region’s communities from the impacts of sea-level rise is high.109,631

Sea level has been rising over recent decades, leading to increases in the frequency of high-tide flooding events. Year-to-year changes remain small in the context of inter-annual natural variability. Impacts of sea-level rise will increase in coming decades.

References
  • 96. Kennedy, D.M. 2024, A review of the vulnerability of low-lying reef island landscapes to climate change and ways forward for sustainable management, Ocean & Coastal Management 249: 106984.
  • 109. Cooley, S.R., Schoeman, D.S., Bopp, L., Boyd, P., Donner, S., et al. 2022, Oceans and coastal ecosystems and their services, in Climate Change 2022: Impacts, Adaptation and Vulnerability. Contribution of Working Group II to the Sixth Assessment Report of the Intergovernmental Panel on Climate Change Cambridge University Press, Cambridge, UK and New York, USA, pp. 379-550.
  • 123. Hamylton, S., Kelleway, J., Rogers, K., McLean, R., Tynan, Z.N., et al. 2023, Mangrove expansion on the low wooded islands of the Great Barrier Reef, Proceedings Royal Society B 290(2010): 20231183.
  • 540. CSIRO and The Bureau of Meteorology 2022, State of the Climate 2022.
  • 553. Knutson, T., Camargo, S.J., Chan, J.C.L., Emanuel, K., Ho, C., et al. 2020, Tropical cyclones and climate change assessment: part II: projected response to anthropogenic warming, Bulletin of the American Meteorological Society 101(3): E303-E322.
  • 582. World Meteorological Organization 2023, State of the Global Climate 2022, WMO, Geneva, Switzerland.
  • 607. Pugh, D. 2004, Changing sea levels: effects of tides, weather and climate, Cambridge University Press, Cambridge, UK.
  • 608. Fox-Kemper, B., Hewitt, H.T., Xiao, C., Aðalgeirsdóttir, G., Drijfhout, S.S., et al. 2021, Ocean, Cryosphere and Sea Level Change, in Climate Change 2021: The Physical Science Basis. Contribution of Working Group I to the Sixth Assessment Report of the Intergovernmental Panel on Climate Change, eds V. Masson-Delmotte, P. Zhai, A. Pirani, S.L. Connors, C. Péan, et al., Cambridge University Press, Cambridge and New York, pp. 1211–1362.
  • 609. Hague, B.S., Jones, D.A., Trewin, B., Jakob, D., Murphy, B.F., et al. 2021, ANCHORS: A multi-decadal tide gauge dataset to monitor Australian relative sea level changes, Geoscience Data Journal 9(2): 256-272.
  • 610. Vignudelli, S., Birol, F., Benveniste, J., Fu, L., Picot, N., et al. 2019, Satellite Altimetry Measurements of Sea Level in the Coastal Zone, Surveys in Geophysics 40(6): 1319-1349.
  • 611. Adebisi, N., Balogun, A., Min, T.H. and Tella, A. 2021, Advances in estimating Sea Level Rise: A review of tide gauge, satellite altimetry and spatial data science approaches, Ocean & Coastal Management 208: 105632.
  • 612. Hague, B.S., Jones, D.A., Jakob, D., McGregor, S. and Reef, R. 2022, Australian coastal flooding trends and forcing factors, Earth's Future 10(2): e2021EF002483.
  • 613. Slangen, A.B.A., Church, J.A., Agosta, C., Fettweis, X., Marzeion, B., et al. 2016, Anthropogenic forcing dominates global mean sea-level rise since 1970, Nature Climate Change 6(7): 701-705.
  • 614. Fox-Kemper, B., Hewitt, H.T., Xiao, C., Aðalgeirsdóttir, G., Drijfhout, S.S., et al. 2021, Ocean, Cryosphere and Sea Level Change Supplementary Material, in Climate Change 2021: The Physical Science Basis. Contribution of Working Group I to the Sixth Assessment Report of the Intergovernmental Panel on Climate Change, eds V. Masson-Delmotte, P. Zhai, A. Pirani, S.L. Connors, C. Péan, et al., Cambridge University Press, Cambridge and New York.
  • 615. Dangendorf, S., Hay, C., Calafat, F.M., Marcos, M., Piecuch, C.G., et al. 2019, Persistent acceleration in global sea-level rise since the 1960s, Nature Climate Change 9(9): 705-710.
  • 616. Zhang, X. 2024, Analysis of sea level trends around Australia. CSIRO analysis conducted for Outlook Report. Unpublished report.
  • 617. NOAA Laboratory for Satellite Altimetry 2024, Altimetry data, <https://www.star.nesdis.noaa.gov/socd/lsa/SeaLevelRise/>.
  • 618. Permanent Service for Mean Sea Level, (PSMSL) 2024, Tide Gauge Data, <http://www.psmsl.org/data/obtaining/>.
  • 619. Holgate, S.J., Matthews, A., Woodworth, P.L., Rickards, L.J., Tamisiea, M.E., et al. 2013, New data systems and products at the permanent service for mean sea level, Journal of Coastal Research 29(3): 493-504.
  • 620. Palmer, M.D., Domingues, C.M., Slangen, A. and Dias, F.B. 2021, An ensemble approach to quantify global mean sea-level rise over the 20th century from tide gauge reconstructions, Environmental Research Letters 16(4): 044043.
  • 621. Beckley, B.D., Callahan, P.S., Hancock Iii, D.W., Mitchum, G.T. and Ray, R.D. 2017, On the “Cal‐Mode” correction to TOPEX satellite altimetry and its effect on the global mean sea level time series, Journal of Geophysical Research: Oceans 122(11): 8371-8384.
  • 622. Hubbard, D.K. 2015, Reef Biology and Geology – Not Just a Matter of Scale, in Coral Reefs in the Anthropocene, ed. C. Birkeland, Springer, Dordrecht, pp. 43–66.
  • 623. Carson, M., Köhl, A., Stammer, D., A. Slangen, A.B., Katsman, C.A., et al. 2016, Coastal sea level changes, observed and projected during the 20th and 21st century, Climatic Change 134: 269-281.
  • 624. Gilman, E., Ellison, J. and Coleman, R. 2007, Assessment of mangrove response to projected relative sea-level rise and recent historical reconstruction of shoreline position, Environmental Monitoring and Assessment 124: 105-130.
  • 625. Gornitz, V. 1991, Global coastal hazards from future sea level rise, Palaeogeography, Palaeoclimatology, Palaeoecology 89(4): 379-398.
  • 626. Hague, B.S., McGregor, S., Murphy, B.F., Reef, R. and Jones, D.A. 2020, Sea level rise driving increasingly predictable coastal inundation in Sydney, Australia, Earth's Future 8(9): e2020EF001607.
  • 627. Rivas, M.L., Rodríguez-Caballero, E., Esteban, N., Carpio, A.J., Barrera-Vilarmau, B., et al. 2023, Uncertain future for global sea turtle populations in face of sea level rise, Scientific Reports 13(1): 5277.
  • 628. Reynolds, M.H., Courtot, K.N., Berkowitz, P., Storlazzi, C.D., Moore, J., et al. 2015, Will the effects of sea-level rise create ecological traps for Pacific island seabirds? PLoS One 10(9): e0136773.
  • 629. Taherkhani, M., Vitousek, S., Barnard, P.L., Frazer, N., Anderson, T.R., et al. 2020, Sea-level rise exponentially increases coastal flood frequency, Scientific Reports 10(1): 6466.
  • 630. Mawson, E.E., Lee, K.C. and Hill, J. 2022, Sea level rise and the Great Barrier Reef the future implications on reef tidal dynamics, Journal of Geophysical Research: Oceans 127(8): e2021JC017823.
  • 631. Dedekorkut-Howes, A., Torabi, E. and Howes, M. 2020, When the tide gets high: a review of adaptive responses to sea level rise and coastal flooding, Journal of Environmental Planning and Management 63(12): 2102-2143.