3.2.3 Freshwater inflow

The Reef receives freshwater inflow from a Catchment area of approximately 424,000 square kilometres, about a quarter the area of Queensland.42 These flows are driven by rainfall patterns that are highly variable on seasonal, inter-annual and decadal timescales. Sixty to 80 per cent of rainfall occurs during the wet season (December to April), often associated with monsoon troughs and the passage of low-pressure systems and cyclones.568 More extremes in flow are being experienced during wet and dry seasons. Variation from year to year is strongly linked to major climatic drivers, such as the El Niño–Southern Oscillation and the Madden–Julian Oscillation (Box 6.1). Monsoonal and cyclonic events can cause major flooding across the Region. These varied temporal patterns are superimposed on decadal rainfall trends occurring due to climate change. 

Rainfall in northern Queensland has increased by around 10 per cent since 1750 and has become more variable, as rainy years became much wetter, while dry years remained dry.569 Heavy rainfall events are predicted to become less frequent but more intense as a result of ongoing global warming.540 Daily rainfall totals associated with thunderstorms have increased since 1979, particularly in northern Australia, but declined in other areas of the Great Barrier Reef Catchment. This trend is expected to continue in future.540

Following rainfall, major river systems transport vast amounts of freshwater runoff from the surrounding landscape, channelling it towards the coast and into the Reef. In many areas along the coast, fresh water is also channelled through extensive networks of wetlands and other coastal ecosystems.36 These act as natural filters and buffers, trapping and removing nutrients (including via denitrification) and sediment before they reach the ocean. Large flood events cause rivers to break their banks and inundate floodplains and wetlands, which affects the dissolved and suspended constituents of water entering the Reef. Historical clearing and draining of coastal wetlands are important legacy impacts affecting the quantity and quality of freshwater inflow.42

The Catchment is made up of 35 major river basins, which vary considerably in their volumes and patterns of discharge. Rivers in the Wet Tropics Natural Resource Management region generally flow year-round; their discharge is driven by groundwater base flow and higher, more consistent rainfall than in other regions. Average rainfall is also relatively high across parts of the Cape York and Mackay Whitsunday regions. Rivers in the Burdekin, Fitzroy and Burnett Mary regions exhibit highly variable discharge that is characterised by very large but infrequent flood events.

The most direct effect of freshwater inflow is a reduction in salinity, to which corals are sensitive.570 Fresh water is less dense than sea water, and it forms surface plumes that extend long distances in calm conditions. Freshwater inflow can also bring with it a range of land-sourced substances, including dissolved and particulate nutrients, suspended fine sediments, pesticides, and plastic waste (Section 6.5). In excess, many of the constituents of land-based runoff act as pollutants and can negatively affect organisms in nearshore waters. For example, land-sourced nutrients drive productivity in the marine environment but excess nutrients can be damaging to ecosystems.571 The combined effects of lower salinity, reduced light due to the suspended sediments, and high sedimentation can contribute to localised coral and seagrass mortality.572 At a Region-wide scale, exposure to floodwaters has been shown to correlate with declines in the recovery rate of coral cover.573

More extremes in flow are being experienced during wet and dry seasons

Freshwater flow has become more variable since European settlement, and more extremes are being experienced during wet and dry seasons.569,574 Substantial changes in freshwater flow into the marine environment also appear to be associated with changes in the El Niño–Southern Oscillation. Historical records show a marked shift in the frequency and size of river discharge from the 1850s and again in the 1950s.574 Cores taken from long-lived corals indicate that the frequency of high freshwater flows into the Region has increased over the past 2 centuries, from every 20 years from 1748 to 1847 to every 6 years from 1948 to 2011.575 Along with climate change, extensive land clearing and changes in land use (Section 6.4) have occurred over this period, altering hydrology in ways that have led to higher freshwater discharges and reduced coastal wetland processing of pollutants. These changes have resulted in water of poor quality entering the Reef lagoon.36 Exposure to freshwater inflow and associated poor water quality over successive years of high-flow events can hinder recovery of nearshore habitats.576,577 Projected increases in the frequency of such freshwater flow events540 mean they are likely to continue to affect condition and recovery trend of these habitats.

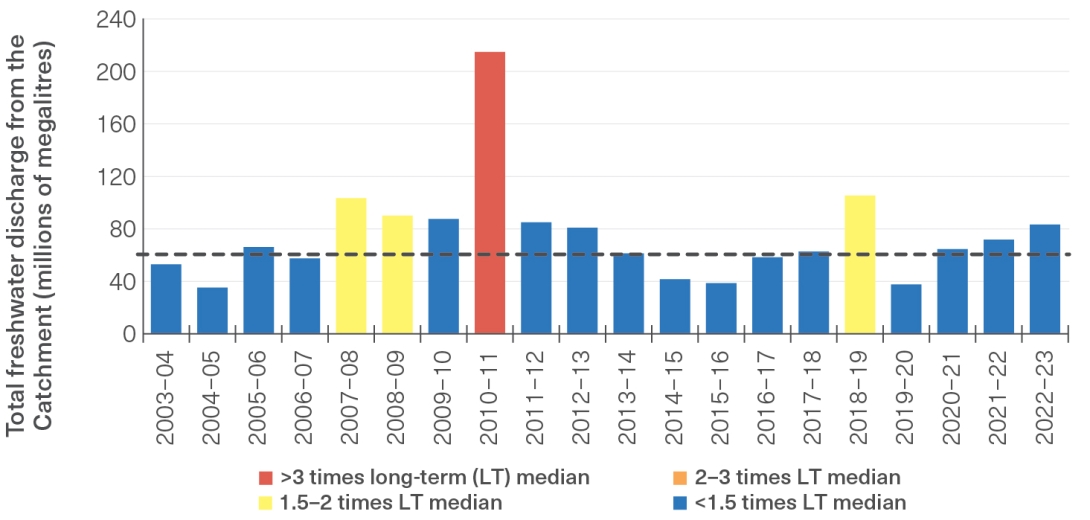
Figure 3.4
Total annual freshwater discharge from major rivers in the Catchment, 2003–04 to 2022–23

Discharge in millions of megalitres (water monitoring year: 1 October to 30 September) for the 35 main Reef river basins. Bar colours: red = >3 times long-term median flow, orange = 2–3 times, yellow = 1.5–2 times, blue = <1.5 times. Dashed grey line indicates long-term median for the total Reef discharge over the period 1990–91 to 2019–20. Source: Gruber et al. (2024).579 Data: Department of Regional Development, Manufacturing and Water (2023).583

Bar graph showing total annual freshwater discharge volume through time. Discharge increased from around 50 million megalitres (less than 1.5 times long term median flow) in 2003/04 to more than 80 million megalitres (between 1.5-2 times the long-term median flow), in 2007/08 and 2008/09, and to a peak of over 200 million megalitres (more than 3 times the long term median flow) in 2010/11.
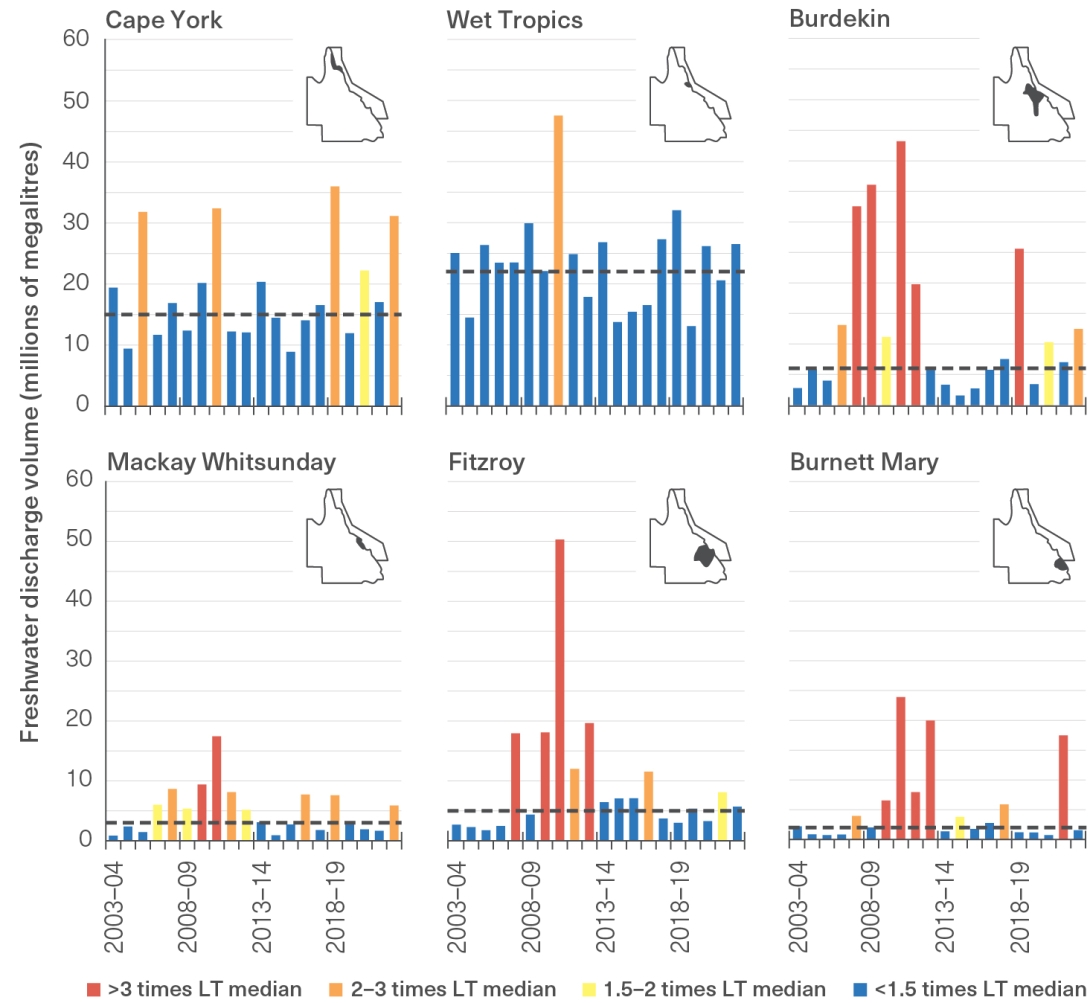
Figure 3.5
Annual freshwater discharge from major rivers, by region, 2003–04 to 2022–23

Discharge in millions of megalitres (water monitoring year: 1 October to 30 September) for the 35 main Reef river basins, aggregated into the 6 natural resource management regions. Bar colours: red = >3 times long-term median flow, orange = 2–3 times, yellow = 1.5–2 times, blue = <1.5 times. Dashed grey line indicates long-term median for each natural resource management region. Source: Gruber et al. (2024).579 Data: Department of Regional Development, Manufacturing and Water (2023).583

Series of 6 bar graphs showing annual freshwater discharge volume through time, from north to south; Cape York, Wet Tropics and Burdekin along the top; Mackay Whitsunday, Fitzroy and Burnett Mary along the bottom.

The Catchment is large, and spatial and temporal variation in freshwater discharge are common. The 2018–19 water monitoring year (October to September) saw significant flooding of the Daintree River and flooding of rivers in the Burdekin region,578 whereas 2019–20 was a dry year in which discharge across the Catchment was below the long-term (1990–91 to 2019–20) median (Figure 3.4). In 2020–21, discharge from the overall Catchment area was just above the long-term median. On a regional basis, the 3 northern natural resource management regions had above-median discharge in 2020–21: Cape York was 1.7 times higher than the long-term median, Wet Tropics 1.2 times higher, and Burdekin 1.7 times higher (Figure 3.5). In comparison, the 3 southern regions had well below median discharge, all recording less than 50 per cent of their long-term median values. In 2021–22, river discharge across the Catchment as a whole was again just above the median.363 However, major floods in some locations led to high regional variation. River discharge in the Burnett Mary region was almost 9 times the long-term median, whereas discharge in the Mackay Whitsunday region was around half the long-term median.363 In 2023, above-median discharge occurred in the Cape York, Burdekin, and Mackay Whitsunday regions.579

Overall, the average annual discharge across the Catchment over the past 5 years (2018–19 to 2022–23) was approximately 1.3 times the long-term median for total Reef discharge (Figure 3.4).579 However, this may be an underestimate of the 5-year average, as data from the intense flooding 580 that followed cyclone Jasper in December 2023 581 are not yet incorporated. The year 2023 marked the third consecutive year of La Niña conditions, a duration which has only occurred 3 times in the past 50 years.582

Reef health surveys documented bleaching on inshore reefs off Cairns following the extreme rainfall associated with cyclone Jasper,581 likely caused by freshwater exposure, but the extent and severity of damage will take time to determine. 

Interactions between freshwater inflow, coastal development (Section 6.4), land-based runoff (Section 6.5), sediment exposure (Section 3.2.4), light (Section 3.2.7), nutrient cycling (Section 3.3.1), and the condition of coastal ecosystems (Section 3.5) are complex and integral to the health of the Reef. 

In summary, over the past 5 years, the average annual freshwater inflow across the Catchment has been just above the long-term average and shown regional variability. Documented and projected changes in rainfall are affecting this process over decades.

References
  • 36. Queensland Museum 2022, Wetlands of Queensland: Queensland Museum discovery guide/published in partnership with the Department of Environment and Science, South Brisbane.
  • 42. Waterhouse, J., Pineda, M., Sambrook, K., Newlands, M., McKenzie, L., et al. 2024, 2022 Scientific Consensus Statement: Conclusions, in 2022 Scientific Consensus Statement on land-based impacts on Great Barrier Reef water quality and ecosystem condition, eds J. Waterhouse, M. Pineda and K. Sambrook, Commonwealth of Australia and Queensland Government.
  • 363. Moran, D., Robson, B., Gruber, R., Waterhouse, J., Logan, M., et al. 2023, Marine Monitoring Program Annual Report 2021-22 Water Quality, Great Barrier Reef Marine Park Authority, Townsville.
  • 540. CSIRO and The Bureau of Meteorology 2022, State of the Climate 2022.
  • 568. Bureau of Meteorology 2023, Rainfall data information, <http://www.bom.gov.au/climate/data/>.
  • 569. Dyez, K.A., Cole, J.E. and Lough, J.M. 2024, Rainfall variability increased with warming in northern Queensland, Australia, over the past 280 years, Communications Earth & Environment 5(1): 117.
  • 570. Dias, M., Madeira, C., Jogee, N., Ferreira, A., Gouveia, R., et al. 2019, Oxidative stress on scleractinian coral fragments following exposure to high temperature and low salinity, Ecological Indicators 107: 105586.
  • 571. Lesser, M.P. 2021, Eutrophication on coral reefs: What is the evidence for phase shifts, nutrient limitation and coral bleaching, BioScience 71(12): 1216-1233.
  • 572. Jones, A.M. and Berkelmans, R. 2014, Flood impacts in Keppel Bay, southern Great Barrier Reef in the aftermath of cyclonic rainfall, PloS One 9(1): e84739.
  • 573. Ortiz, J., Wolff, N.H., Anthony, K.R.N., Devlin, M., Lewis, S., et al. 2018, Impaired recovery of the Great Barrier Reef under cumulative stress, Science Advances 4(7): eaar6127.
  • 574. Lewis, S., Bainbridge, Z. and Smithers, S. 2024, 2022 Scientific Consensus Statement: Summary | Evidence Statement for Question 2.3: What evidence is there for changes in land-based runoff from pre-development estimates in the GBR? in 2022 Scientific Consensus Statement on land-based impacts on Great Barrier Reef water quality and ecosystem condition, eds J. Waterhouse, M. Pineda and K. Sambrook, Commonwealth of Australia and Queensland Government.
  • 575. Lough, J.M., Lewis, S.E. and Cantin, N.E. 2015, Freshwater impacts in the central Great Barrier Reef: 1648-2011, Coral Reefs 34(3): 739-751.
  • 576. Lambert, V., Bainbridge, Z.T., Collier, C., Lewis, S.E., Adams, M.P., et al. 2021, Connecting targets for catchment sediment loads to ecological outcomes for seagrass using multiple lines of evidence, Marine Pollution Bulletin 169: 112494.
  • 577. McKenna, S., Jarvis, J., Sankey, T., Reason, C., Coles, R., et al. 2015, Declines of seagrasses in a tropical harbour, North Queensland, Australia, are not the result of a single event, Journal of Biosciences 40(2): 389-398.
  • 578. Moran, D., Robson, B., Gruber, R., Waterhouse, J., Logan, M., et al. 2022, Marine Monitoring Program: Annual Report for Inshore Water Quality Monitoring 2020-21. Report for the Great Barrier Reef Marine Park Authority, Great Barrier Reef Marine Park Authority, Townsville.
  • 579. Gruber, R., Moran, D., Robson, B., Waterhouse, J., Logan, M., et al. 2024, Marine Monitoring Program: Annual report for inshore water quality monitoring 2022–23. Report for the Great Barrier Reef Marine Park Authority, Great Barrier Reef Marine Park Authority, Townsville.
  • 580. Bureau of Meteorology 2024, Queensland in December 2023, <http://www.bom.gov.au/climate/current/month/qld/archive/202312.summary.shtml>.
  • 581. Bureau of Meteorology 2024, Annual climate statement 2023, <http://www.bom.gov.au/climate/current/annual/aus/2023/Annual-Statement-2023.pdf>.
  • 582. World Meteorological Organization 2023, State of the Global Climate 2022, WMO, Geneva, Switzerland.
  • 583. Department of Regional Development, Manufacturing and Water 2023, River Discharge Data, <https://water-monitoring.information.qld.gov.au/>.