3.4.3 Primary production

Primary production, which refers to the initial synthesis of organic compounds from carbon dioxide and energy, provides the basis for all biological systems. Nearly all primary production within the Region occurs through the process of photosynthesis. Primary producers within the Region include phytoplankton, benthic algae, mangroves, and seagrasses. Many reef organisms, notably including corals, benefit from symbiotic associations with primary producers (Section 3.4.6). Algal symbionts of corals transfer between 40 and 80 per cent of their photosynthetically fixed carbon to their hosts, supporting coral growth and metabolism 800 and contributing to their evolutionary success.801

Photosynthesis is closely linked to the availability of light (Section 3.2.7) and generally occurs in the upper water column at depths of less than 100 metres.672 Rates of primary production depend on available light and the efficiency with which organisms can use it for photosynthesis.682 The availability of inorganic nutrients, such as nitrogen and phosphorus, is also critical in determining rates of primary production. Within the Region, peaks in primary productivity tend to occur in inshore waters as a result of elevated fluxes of nutrients from river flows and tidal mixing 802 particularly during the wet season.803 Nutrients are also supplied through inflow from the Coral Sea, upwelling and resuspension of sediments,802 and via nitrogen-fixing bacterioplankton.804 In some cases, increased primary productivity can signal a decline in water quality,363 or it may indicate phase shifts and the presence of prior ecological disturbances.749

Primary production supports healthy ecosystems but can also cause imbalances

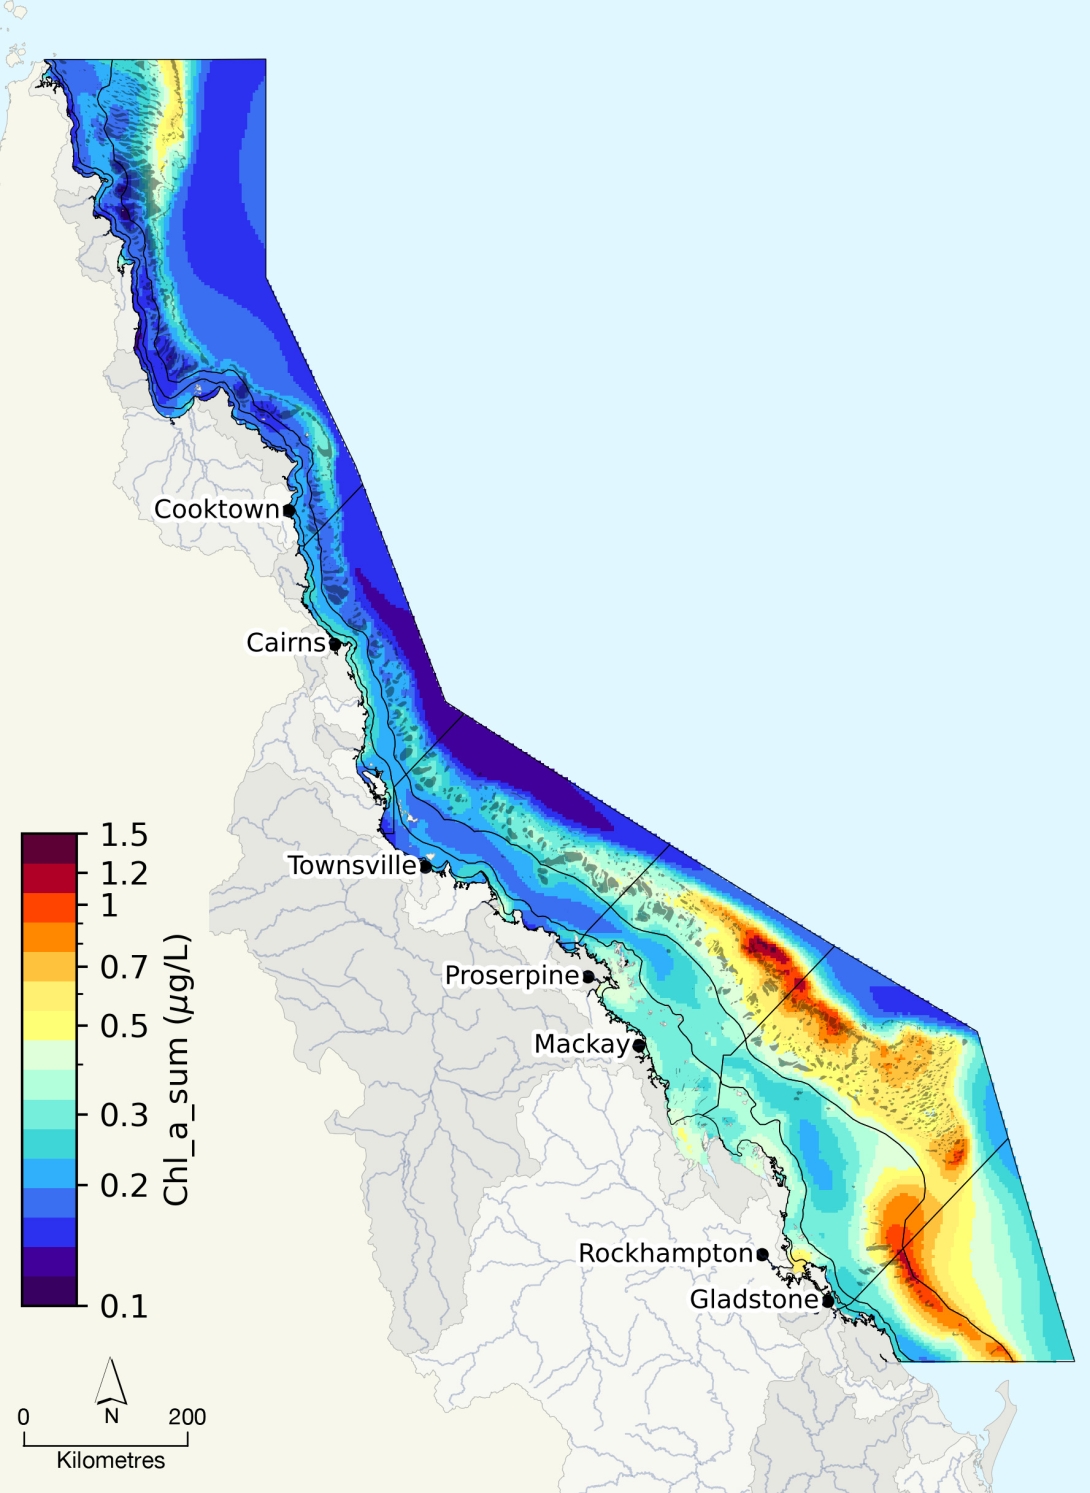
In lieu of directly measuring primary production, trends in abundance of primary producers may be used as a rough proxy for the condition of this process. Chlorophyll-a (Figure 3.12) is commonly used to estimate phytoplankton biomass. Between 2017 and 2022 concentrations of chlorophyll-a in most inshore areas within the Region decreased, suggesting a reduction in phytoplankton productivity and improvements in water quality over this period.363 In the past few years, inshore seagrasses within the Region have shown signs of recovery following previous decline (except for in the southern Fitzroy and Burnett Mary regions, where condition remains poor) (Section 2.4.2).145 The condition and extent of mangroves (Section 2.4.1) and benthic algae (Section 2.4.3) have remained relatively stable within the Region, which may suggest little change in primary production in these areas. While hard coral cover on offshore reefs has increased overall since 2019, the condition of individual reefs is highly variable (Section 2.3.5), and mass coral bleaching in, 2020 and 2022 likely affected rates of primary production. 

Overall, primary production as a process is considered to be functioning well. Some shifts in the type of primary production (less in the water column, more in benthic producers) may have occurred in inshore areas as a result of improved water quality since 2019. Primary producers in some areas continue to be affected by high nutrient levels, sediment and temperature. 

Figure 3.12
Modelled annual average total chlorophyll-a near the surface, 2011 to 2018

This map highlights coastal and offshore areas with increased annual average chlorophyll-a (as an indicator of phytoplankton biomass). Availability of nutrients, such as dissolved inorganic nitrogen (Figure 3.11) is important for photosynthesis. Peaks in nearshore phytoplankton abundance are influenced by increased nutrient supply in river plumes, while offshore peaks are likely driven by inflow of nutrients from the Coral Sea and upwellings. Source: Lawrey (2023). eReefs BGC Seasonal plots for Scientific Consensus 2023 [Source code]. Australian Institute of Marine Science, Townsville. https://github.com/open-AIMS/ereefs-scientific-consensus-wq-plots-2023, using data from eReefs 4 km resolution model output. Model includes latest data available in December 2023.710 

Map of the Great Barrier Reef Region and World Heritage boundary showing modelled estimates of chlorophyll-a. Values range from 0.1 (in dark purple) to 1.5 micrograms (in dark red) per Litre. Lowest values, between 0.1 and 0.15 micrograms per Litre, are mostly offshore of the continental shelf between Cairns and Townsville, and some smaller areas around the inner-mid shelf reefs north of Princess Charlotte Bay.
References
  • 145. McKenzie, L.J., Collier, C.J., Langlois, L.A. and Yoshida, R.L. 2023, Marine Monitoring Program: annual report for inshore seagrass monitoring 2021–22. Report for the Great Barrier Reef Marine Park Authority, Great Barrier Reef Marine Park Authority, Townsville.
  • 363. Moran, D., Robson, B., Gruber, R., Waterhouse, J., Logan, M., et al. 2023, Marine Monitoring Program Annual Report 2021-22 Water Quality, Great Barrier Reef Marine Park Authority, Townsville.
  • 672. Hoegh-Guldberg, O. and Dove, S. 2019, Primary production, nutrient recycling and energy flow through coral reef ecosystems, The Great Barrier Reef: Biology, Environment and Management. Second Edition: 85-100.
  • 682. Hochberg, E.J., Pisapia, C., Carpenter, R.C. and Hall, S. 2024, Light-use efficiency for coral reef communities and benthic functional types, Limnology and Oceanography 69(3): 712-722.
  • 710. Robson, B., Brown, A. and Uthicke, S. 2024, 2022 Scientific Consensus Statement: Summary | Evidence Statement for Question 4.1: What is the spatial and temporal distribution of nutrients and associated indicators within the GBR? in 2022 Scientific Consensus Statement on land-based impacts on Great Barrier Reef water quality and ecosystem condition, eds J. Waterhouse, M. Pineda and K. Sambrook, Commonwealth of Australia and Queensland Government.
  • 749. Davis, K.L., Colefax, A.P., Tucker, J.P., Kelaher, B.P. and Santos, I.R. 2021, Global coral reef ecosystems exhibit declining calcification and increasing primary productivity, Communications Earth & Environment 2(1): 105.
  • 800. Wiedenmann, J., D’angelo, C., Mardones, M.L., Moore, S., Benkwitt, C.E., et al. 2023, Reef-building corals farm and feed on their photosynthetic symbionts, Nature 620(7976): 1018-1024.
  • 801. LaJeunesse, T.C., Parkinson, J.E., Gabrielson, P.W., Jeong, H.J., Reimer, J.D., et al. 2018, Systematic revision of Symbiodiniaceae highlights the antiquity and diversity of coral endosymbionts, Current Biology 28(16): 2570-2580. e6.
  • 802. Alongi, D.M., Patten, N.L., McKinnon, D., Köstner, N., Bourne, D.G., et al. 2015, Phytoplankton, bacterioplankton and virioplankton structure and function across the southern Great Barrier Reef shelf, Journal of Marine Systems 142: 25-39.
  • 803. Petus, C., Waterhouse, J., Lewis, S., Vacher, M., Tracey, D., et al. 2019, A flood of information: Using Sentinel-3 water colour products to assure continuity in the monitoring of water quality trends in the Great Barrier Reef (Australia), Journal of Environmental Management 248: 109255.
  • 804. Messer, L.F., Brown, M.V., Furnas, M.J., Carney, R.L., McKinnon, A.D., et al. 2017, Diversity and activity of diazotrophs in Great Barrier Reef surface waters, Frontiers in Microbiology 8: 967.